- Collection:
- Georgia Government Publications
- Serial:
- Georgia epidemiology report / Georgia Dept. of Human Resources, Office of Epidemiology.
- Title:
- Georgia epidemiology report, Vol. 20, no. 8 (Aug. 2004)
- Creator:
- Georgia. Office of Epidemiology
Georgia. Division of Public Health. Epidemiology Section
Georgia. Epidemiology Branch
Epidemiology Program (Ga.) - Contributor to Resource:
- Georgia. Epidemiology Branch
- Publisher:
- Atlanta, Ga. : Epidemiology Section of the Epidemiology and Prevention Branch, Division of Public Health, Department of Human Resources
Atlanta, Ga : Epidemiology Section of the Epidemiology and Health Information Branch, Division of Public Health, Georgia Department of Human Resources
Atlanta, Ga. : Epidemiology Branch, Division of Public Health, Georgia Department of Human Resources
Atlanta, Ga. : Georgia Department of Public Health, Epidemiology Program - Date of Original:
- 2004-08
- Subject:
- Public health--Georgia--Periodicals
Epidemiology
Mortality
Public Health
Public health
Medical statistics - Location:
- United States, Georgia, 32.75042, -83.50018
- Medium:
- state government records
- Type:
- Text
- Format:
- application/pdf
- Description:
- "The Georgia Epidemiology Report (GER) is a monthly publication of the Epidemiology Section, Division of Public Health, Georgia Department of Human Resources. The GER is distributed monthly to over 30,000 physicians, nurses, laboratories, and public health officials throughout the State of Georgia. The GER's focus is on public health issues in Georgia, but it may also report on national health issues."--The Georgia Epidemiology Report opening page
- External Identifiers:
- Call Number GA H800.E5 P1 E5 20/8
- Metadata URL:
- https://dlg.galileo.usg.edu/id:dlg_ggpd_i-ga-bh800-pe5-bp1-be5-b20-s8-belec-p-btext
- Digital Object URL:
- https://dlg.galileo.usg.edu/do:dlg_ggpd_i-ga-bh800-pe5-bp1-be5-b20-s8-belec-p-btext
- Language:
- eng
- Holding Institution:
- University of Georgia. Map and Government Information Library
- Rights:
-

August 2004
volume 20 number 08
Chronic Lower Respiratory Disease Mortality and Morbidity in Georgia, 1999 - 2002
Introduction
Chronic lower respiratory disease is a common condition characterized by airflow obstruction that is not fully reversible and breathingrelated symptoms such as chronic cough, exertional dyspnea, expectoration, and wheeze.1 Chronic lower respiratory disease includes chronic bronchitis, emphysema, and bronchiectasis. The major cause of chronic lower respiratory disease is smoking; 80% to 90% of all patients with chronic lower respiratory disease have a history of smoking.2, 3 Smoking cessation is the only intervention that has proven successful in reducing the rate of decline in lung function.4 Other factors that may contribute to chronic lower respiratory disease are exposure to dust, fumes, or gases that may be found in the home or workplace.5
on hospital inpatient discharge data for Georgia residents who were hospitalized during 1999 through 2002 at non-federal acute care hospitals with chronic lower respiratory disease as the principle diagnosis. The ICD-9-CM codes used to select hospitalizations were 490-492, 494, and 496. Rates were age adjusted to the 2000 US standard population. Hospital charges are based upon a hospital's full established rates and differ from costs. The amount a hospital is reimbursed is usually less than what is charged.
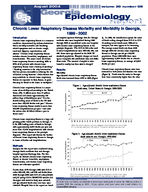
Results Mortality Age-adjusted chronic lower respiratory disease death rates increased from 1979 to 1998 (Figure
1). In 1999, the classification system for cause of death coding changed from ICD-9 to ICD10 making recent trends more difficult to interpret, but rates appear to be increasing. The average annual death rate from 1999 through 2002 for chronic lower respiratory disease in Georgia was 46 per 100,000 population. From 1999-2002 there were approximately 11,800 deaths due to chronic lower respiratory disease, an average of 2,950 deaths per year.
Chronic lower respiratory disease rates have increased in both males and females over time (Figure 2). Death rates for males in Georgia have been consistently higher than the rates
Chronic lower respiratory disease is a major cause of morbidity and mortality in the United States (US). It affects more than 17 million Americans and causes approximately 150 million days of disability per year.6 It is the fourth leading cause of death in the US with more than 100,000 deaths each year.7 Chronic lower respiratory disease results in more than 500,000 hospitalizations per year 8 and costs the nation over 18 billion dollars a year in direct costs.9
Deaths per 100,000 population
Figure 1. Age-adjusted chronic lower respiratory disease death rates, United States & Georgia 1999-2002
Deaths per 100,000 population
Chronic lower respiratory disease is a large and growing public health problem in Georgia. It is the fifth leading cause of death in Georgia with approximately 2,950 deaths per year and more than 17,650 hospitalizations with chronic lower respiratory disease as the principle diagnosis. This report will discuss the burden of chronic lower respiratory disease in Georgia
in terms of deaths and hospitalizations.
Figure 2. Age-adjusted chronic lower respiratory disease death rates by sex, Georgia 1979-2002
Deaths per 100,000 population
Methods
Analyses for this report were conducted using Georgia death certificate data and Georgia hospital inpatient discharge data. For this report, we defined chronic lower respiratory disease as chronic bronchitis, emphysema, bronchiectasis, and chronic lower respiratory disease not otherwise specified.
Deaths from 1979 through 1998 with ICD-9 codes 490-492, 494, and 496 and deaths from 1999 through 2002 with ICD-10 codes J40-J44 and J47 (using CDC's WONDER website and Georgia's vital statistics data) were selected, and age-adjusted death rates over time were obtained. Hospital data in the report are based
The Georgia Epidemiology Report Via E-Mail
To better serve our readers, we would like to know if you would prefer to receive the GER by e-mail as a readable PDF file starting in 2004. If yes, please send your name and e-mail address to Gaepinfo@dhr.state.ga.us.
for females; however, female rates are increasing faster than male rates each year (an increase of 1.3 per 100,000 per year vs. 0.8 per 100,000 per year). The steady increase in female chronic lower respiratory disease death rates mirrors the increase in female smoking rates until the mid 1960's. 10 Many diseases disproportionately affect minorities, but whites were 2.1 times more likely to die from chronic lower respiratory disease than blacks (Figure 3). Chronic lower respiratory disease death rates increased with age (Figure 4).
Mortality by County Twenty-two of Georgia's 159 counties had death rates in 1999-2002 that were significantly higher than the state rate (46 deaths per 100,000 population) (Figure 5). Counties with high rates are scattered throughout Georgia.
Morbidity During 2001 there were more than 17,650 hospitalizations (253 per 100,000 population) with chronic lower respiratory disease as the principle diagnosis in Georgia. Hospital charges in Georgia for chronic lower respiratory disease hospitalizations totaled approximately $200 million dollars in 2001. Age-adjusted hospitalization rates were five times higher than death rates. Hospitalization rates in Georgia among males were slightly higher than rates among females (260 per 100,000 vs. 254 per 100,000 population). Whites were 1.6 times more likely to be hospitalized from chronic lower respiratory disease than blacks (271 per 100,000 vs. 169 per 100,000 population). White females had the highest hospitalization rates (282 per 100,000 population) among the four major race/sex groups (Figure 6). Hospitalization rates for chronic lower respiratory diseases were highest among the elderly population.
Smoking Prevalence Smoking is the most important cause of chronic lower respiratory disease. The prevalence of smoking among adults in Georgia declined about 2.6% per year from 1985 to 1993, but has been increasing slowly, about 0.6% per year, since then. The percentage of adults who smoked in Georgia was consistently higher among males than females from 1985 to 2002 (Figure 7). During the same period, the percentage of adults who smoked was also higher among whites than blacks for both males and females.
Conclusions Chronic lower respiratory disease is a significant contributor to mortality and morbidity in Georgia, with an average of 2,950 deaths per year from 1999-2002, and approximately 17,650 hospitalizations in 2001. Chronic lower respiratory disease affects all races, sexes, and age groups, but whites are more likely to die or be
Figure 3. Age-adjusted chronic lower respiratory disease deaths rates by race, Georgia, 1999-2002
Figure 4. Chronic lower respiratory disease death rates by age group, Georgia 1999-2002
Figure 5. Age-adjusted death rates for chronic lower respiratory disease, Georgia 1999-2002
-2 -
Figure 6. Age-adjusted chronic lower respiratory disease hospitalization rates by race and sex, Georgia, 2001
hospitalized from chronic lower respiratory disease than blacks. Males are more likely to die or be hospitalized than females. This may be due to the increase in smoking rates among women since the 1940's, relative to men. 11 Also, older age groups are more frequently affected by chronic lower respiratory disease, which is probably due, in part, to long-term smoking habits.
Despite the fact that smoking has been proven to be the major factor in the development of chronic lower respiratory disease and many other diseases, many Georgians continue to smoke. Smoking cessation interventions and policies can influence trends in chronic lower
respiratory disease.
Figure 7. Prevalence of smoking among adults (18+ years) by race and sex, Georgia, 1985-2002*
Recommendations
People who do not smoke should not start, and people who do smoke need to seek help to quit to avoid the development of chronic lower respiratory disease.
People with early chronic lower respiratory disease may be more willing to stop smoking than people with no symptoms, and should be urged to do so.
Exposure to tobacco smoke should be eliminated for people with chronic lower respiratory disease.
* 3 year rolling average Source: Behavior Risk Factor Surveillance System
This article was written by Angela Blackwell, M.P.H., Manxia Wu, M.D., M.P.H., Kristen Mertz, M.D., M.P.H., and Kenneth Powell, M.D., M.P.H.
References
1) Rennard SI. COPD: Overview of definitions, epidemiology and factors influencing its development. Chest 1985; 113(4Suppl): 23S-41S. 2) U.S. Department of Health Human Services. The Health Benefits of Smoking Cessation. A report of the surgeon general. U.S. Government
Printing Office, Washington, DC. 1990. 3) British Thoracic Society. BTS Guidelines for the management of COPD. Thorax 1997; 52(Suppl5): S1-S28. 4) Anthonisen NR, Connett JE, Murray RP. Smoking and lung function of Lung Health Study participants after 11 years. American Journal of
Respiratory and Critical Care Medicine 2002; 166: 675-679. 5) Becklake MR. Chronic airflow limitation: its relationship to work industry occupations. Chest 1985; 88:608-617. 6) Adams PF, Hendershot GE, Marano MA. Current estimates from the National Health Interview Survey, 1996. Vital Health Statistics 1999; 10: 1-
212. 7) Kochanek KD, Smith BL. Deaths: Preliminary Data for 2002. National Vital Statistics Report; Vol. 52 no. 13 Hyattsville, Maryland: National
Center for Health Statistics. 2004. 8) Owings MF, Lawrence L. Detailed diagnosis and procedures National Hospital Discharge Survey, 1997. Vital Health Statistics 1999; 13:1-157. 9) Sullivan SD, Ramsey SD, Lee TA. The economic burden of chronic obstructive pulmonary disease. Chest 2000; 117(Suppl): 5S-9S. 10) Data compiled by the Centers for Disease Control and Prevention, Office on Smoking and Health, from the Current Population Survey, 1955,
and the National Health Interview Surveys, 1965-1994. 11) Shopland DR. Tobacco use and its contribution to early cancer mortality with a special emphasis on cigarette smoking. Environmental Health
Perspective 1995; 103(Suppl8): 131-142.
Division of Public Health http://health.state.ga.us
Kathleen E. Toomey, M.D., M.P.H. Director
State Health Officer
Epidemiology Branch http://health.state.ga.us/epi
Paul A. Blake, M.D., M.P.H. Director
State Epidemiologist
Mel Ralston Public Health Advisor
Georgia Epidemiology Report Editorial Board
Carol A. Hoban, M.S., M.P.H. Editor
Kathryn E. Arnold, M.D. Paul A. Blake, M.D., M.P.H. Susan Lance-Parker, D.V.M., Ph.D. Kathleen E. Toomey, M.D., M.P.H. Angela Alexander - Mailing List Jimmy Clanton, Jr. - Graphic Designer
-3 -
Division of Public Health Two Peachtree St., N.W. Atlanta, GA 30303-3186 Phone: (404) 657-2588 Fax: (404) 657-7517
Georgia Department of Human Resources
Please send comments to: Gaepinfo@dhr.state.ga.us
The Georgia Epidemiology Report Epidemiology Branch Two Peachtree St., NW Atlanta, GA 30303-3186
PRESORTED STANDARD U.S. POSTAGE
PAID ATLANTA, GA PERMIT NO. 4528
August 2004
Volume 20 Number 08
Reported Cases of Selected Notifiable Diseases in Georgia Profile* for May 2004
Selected Notifiable Diseases
Campylobacteriosis Chlamydia trachomatis Cryptosporidiosis E. coli O157:H7 Giardiasis Gonorrhea Haemophilus influenzae (invasive) Hepatitis A (acute) Hepatitis B (acute) Legionellosis Lyme Disease Meningococcal Disease (invasive) Mumps Pertussis Rubella Salmonellosis Shigellosis Syphilis - Primary Syphilis - Secondary Syphilis - Early Latent Syphilis - Other** Syphilis - Congenital Tuberculosis
Total Reported for May 2004
2004 53 2437 11 4 64 1046 18 28 50 12 0 2 0 2 0 115 63 2 4 3 18 0 31
Previous 3 Months Total
Ending May
2002
2003
2004
160
145
124
8486
9072
8187
21
24
21
12
4
13
206
170
183
4570
4373
3449
24
21
42
146
131
89
116
148
174
5
9
17
0
5
4
12
9
3
2
1
0
9
12
7
0
0
0
316
254
244
314
374
156
21
31
16
71
123
57
153
230
73
180
232
99
4
3
0
158
132
118
Previous 12 Months Total
Ending in May
2002
2003 2004
645
657
600
33860
35733
34275
156
117
147
56
38
35
903
904
847
18941
18632
16196
104
74
111
833
504
720
441
546
714
14
26
40
2
12
8
42
34
26
4
1
2
26
34
28
0
0
1
1787
1893
2057
1130
1962
822
106
116
123
296
423
401
684
790
525
801
829
654
22
12
5
572
551
535
* The cumulative numbers in the above table reflect the date the disease was first diagnosed rather than the date the report was received at the state office, and therefore are subject to change over time due to late reporting. The 3 month delay in the disease profile for a given month is designed to minimize any changes that may occur. This method of summarizing data is expected to provide a better overall measure of disease trends and patterns in Georgia.
** Other syphilis includes latent (unknown duration), late latent, late with symptomatic manifestations, and neurosyphilis.
AIDS Profile Update
Report Period
Latest 12 Months: 08/03-07/04 Five Years Ago: 08/99-07/00 Cumulative: 07/81-07/04
Total Cases Reported* <13yrs >=13yrs Total
8
1,844 1,852
8
1,316 1,324
219
28,450 28,669
Percent Female
28.0
26.9
18.7
Risk Group Distribution (%) MSM IDU MSM&IDU HS Blood Unknown
34.0
6.8
1.8
14.9
1.0
41.4
32.6
12.5
3.3
20.8
1.7
29.0
46.5
16.4
5.2
14.3
1.9
15.8
Race Distribution (%) White Black Other
20.9 75.3
3.8
20.3 76.3
3.4
32.6 64.8
2.6
MSM - Men having sex with men
IDU - Injection drug users
HS - Heterosexual
* Case totals are accumulated by date of report to the Epidemiology Section
- 4 -