- Collection:
- Georgia Government Publications
- Serial:
- County jail inmate population report.
- Title:
- County jail inmate population report, 2014 December
- Creator:
- Georgia. Department of Community Affairs. Office of Research
Georgia Crime Information Center
Georgia Sheriffs Association
Association County Commissioners of Georgia - Contributor to Resource:
- Georgia. Department of Community Affairs
- Publisher:
- Atlanta, Ga. : Georgia. Department of Community Affairs. Office of Research
- Date of Original:
- 2014-12-18
- Subject:
- Jails--Georgia--Statistics--Periodicals
Prisons--Géorgie (État)--Statistiques--Périodiques
Jails - Location:
- United States, Georgia, 32.75042, -83.50018
- Medium:
- monthlies
monthly reports - Type:
- Text
- Format:
- application/pdf
- Description:
- "Department of Community" in publishing statement appears to refer to Department of Community Affairs.
Some issues from Georgia Government Publications Database may include cover letters containing alternate titles. July 5, 2001 issue from Georgia Government Publications Database includes cover letter including alternate titles and a chart called: Profile of county jails: capacity. December 2, 1999-May 4, 2000 from Georgia Government Publications Database includes section at beginning called: Statistical data on county jails, January 1990-December 1999.
Volumes for July 2009- issued by Georgia Department of Community Affairs, Office of Research.
Description based on: June 3, 1999; title from PDF caption (GALILEO, viewed February 20, 2018).
Latest issue consulted: May 7, 2020 (publisher's Web site, viewed June 15, 2020). - External Identifiers:
- Call Number GA C495 .P1 J3 2014/12
- Metadata URL:
- https://dlg.galileo.usg.edu/id:dlg_ggpd_i-ga-bc495-b-pp1-bj3-b2014-s12-belec-p-btext
- Digital Object URL:
- https://dlg.galileo.usg.edu/do:dlg_ggpd_i-ga-bc495-b-pp1-bj3-b2014-s12-belec-p-btext
- Language:
- eng
- Holding Institution:
- University of Georgia. Map and Government Information Library
- Rights:
-

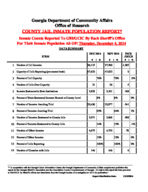
Georgia Department of Community Affairs Office of Research
COUNTY JAIL INMATE POPULATION REPORT*
Inmate Counts Reported To GBI/GCIC By Each Sheriff's Office For Their Inmate Population AS OF: Thursday, December 4, 2014
DATA SUMMARY
ITEM
DEC 2014
# |%
NOV 2014
# |%
INCR /DECR
# |%
1 Number of Jail Inmates
36,115
37,500
-1,385
2 Capacity of Jails Reporting (permanent beds)
47,622
47,622
0
3 Percent of Jail Capacity
76%
79%
-3%
4 Number of Jails Over Capacity
21
26
-5
5 Inmates Sentenced to State Institutions
2,933
3,101
-168
6 Percent of State-Sentenced Inmates Housed at County Level
8%
8%
0%
7 Number of Inmates Awaiting Trial
23,436
23,977
-541
8 Percent of Inmates Awaiting Trial
65%
64%
1%
9 Number of Inmates Sentenced to County Jails
5,071
5,669
-598
10 Percent of Inmates Sentenced to County Jails
14%
15%
-1%
11 Number of Other Inmates
4,675
4,753
-78
12 Percent of Other Inmates
13%
13%
0%
13 Percent of Jails Reporting
100%
100%
0%
14 Number of Counties with Jails
146
146
0
"* In cooperation with the Georgia Crime Information Center, the Georgia Department of Community Affairs compiles and publishes this report for the Georgia Sheriff's Association and the Association County Commissioners of Georgia. All data in this report has been provided to GBI/GCIC by Sheriff's offices and transferred from the Georgia Bureau of Investigation to DCA for publication."
Report Distribution Date:
12/18/2014
Georgia Department of Community Affairs Office of Research
Jail Composition December 2014
4,675, 13%
Inmates Awaiting Trial
5,071, 14% 2,933, 8%
Inmates Sentenced to State Institutions
23,436, 65%
County Sentenced Inmates Other Inmates
Source: All data in this report has been provided to DCA by the Georgia Bureau of Investigation (GBI).
Georgia Department of Community Affairs Office of Research
COUNTY JAIL CAPACITY - 10 Year ANNUAL TREND Jan 2004 to Jan 2014
50,000 47,500 45,000 42,500 40,000 37,500 35,000 32,500 30,000 27,500 25,000
35,152
36,857
37,807
39,747
41,553
42,228
44,897
45,212
45,760
47,015
47,421
Jan Jan Jan Jan Jan Jan Jan Jan Jan Jan Jan 2004 2005 2006 2007 2008 2009 2010 2011 2012 2013 2014
COUNTY JAIL CAPACITY - LAST 12 MONTHS
49,000
48,500
48,000
47,500
47,421 47,421 47,533 47,533 47,533 47,533 47,533 47,533 47,533
47,622 47,622 47,622
47,000
46,500
46,000
45,500
45,000
Jan Feb Mar Apr May Jun Jul 14 Aug Sep Oct Nov Dec
14 14 14 14 14 14
14 14 14 14 14
Source: All data in this report has been provided to DCA by the Georgia Bureau of Investigation (GBI).
Georgia Department of Community Affairs Office of Research
50,000 47,500 45,000 42,500 40,000 37,500 35,000 32,500 30,000 27,500 25,000 22,500 20,000
JAIL POPULATION - 10 Year ANNUAL TREND Jan 2004 - Jan 2014
31,797
33,198
37,335
36,069
36,984
39,919
38,803
40,648
39,059
35,743
34,057
Jan Jan Jan Jan Jan Jan Jan Jan Jan Jan Jan 2004 2005 2006 2007 2008 2009 2010 2011 2012 2013 2014
JAIL POPULATION - Last 12 Months
40,000
34,057 35,777
35,001 35,368
35,883 36,876 37,004 38,388 37,651 37,598 37,500
36,115
37,500
35,000
32,500
30,000
27,500
25,000
Jan Feb Mar Apr May Jun Jul 14 Aug Sep Oct Nov Dec
14 14 14 14 14 14
14 14 14 14 14
Source: All data in this report has been provided to DCA by the Georgia Bureau of Investigation (GBI).
Georgia Department of Community Affairs Office of Research
50,000 45,000 40,000 35,000 30,000 25,000 20,000
35,152
31,797
36,857
33,198
37,807
37,335
39,747
36,069
41,553
36,984
JAIL CAPACITY VS INMATE POPULATION - 10 Year ANNUAL TREND Jan 2004 - Jan 2014
Jan Jan Jan Jan Jan Jan Jan Jan Jan Jan 2004 2005 2006 2007 2008 2009 2010 2011 2012 2013
42,228
39,919
44,897
38,803
45,212
40,648
45,760
39,059
47,015
35,743
47,421
Jan 2014
CAPACITY
INMATES
34,057
34,057 35,777 35,001 35,368 35,883 36,876 37,004
38,388 37,651 37,598 37,500 36,115
JAIL CAPACITY VS INMATE POPULATION - LAST 12 MONTHS
47,421 47,421 47,533 47,533 47,533 47,533 47,533 47,533 47,533 47,622 47,622 47,622
50,000
45,000
40,000
35,000
30,000
25,000
Jan 14Feb 14Mar 14 Apr 14 May Jun 14 Jul 14 Aug Sep Oct 14 Nov Dec
14
14 14
14 14
CAPACITY
INMATES
Source: All data in this report has been provided to DCA by the Georgia Bureau of Investigation (GBI).
Georgia Department of Community Affairs Office of Research
7,000 6,500 6,000 5,500 5,000 4,500 4,000 3,500 3,000 2,500 2,000 1,500 1,000
INMATES SENTENCED TO STATE - 10 Year ANNUAL TREND Jan 2004 - Jan 2014
4,855
4,486
4,325
3,508
3,278
5,277
5,073
5,994
4,798
3,525
Jan Jan Jan Jan Jan Jan Jan Jan Jan Jan 2004 2005 2006 2007 2008 2009 2010 2011 2012 2013
2,263
Jan 2014
INMATES SENTENCED TO STATE - Last 12 Months
4,000
3,500
3,000
2,263 2,069
2,263 2,366 2,279
2,213 2,124 1,988 2,225
2,696 3,101
2,933
2,500
2,000
1,500
1,000
Jan Feb Mar Apr 14 May Jun Jul 14 Aug Sep Oct 14 Nov Dec
14 14 14
14 14
14 14
14 14
Source: All data in this report has been provided to DCA by the Georgia Bureau of Investigation (GBI).
Georgia Department of Community Affairs Office of Research
25,000 24,000 23,000 22,000 21,000 20,000 19,000 18,000 17,000 16,000 15,000
INMATES AWAITING TRIAL IN JAIL - 10 Year ANNUAL TREND Jan 2004 - Jan 2014
23,956
24,216 24,004
23,136 22,059 22,495
23,345
22,450 22,730
20,288 19,411
Jan Jan Jan Jan Jan Jan Jan Jan Jan Jan Jan 2004 2005 2006 2007 2008 2009 2010 2011 2012 2013 2014
INMATES AWAITING TRIAL IN JAIL - Last 12 Months
26,000
25,000
22,730 24,180
22,837 23,196 23,356 24,023 24,483 25,147 25,330 24,584 23,977 23,436
24,000
23,000
22,000
21,000
20,000
19,000
18,000
Jan Feb Mar Apr 14 May Jun Jul 14 Aug Sep Oct 14 Nov Dec
14 14 14
14 14
14 14
14 14
Source: All data in this report has been provided to DCA by the Georgia Bureau of Investigation (GBI).
County Jail Report
Primary Jail Capacity Data December 2014
(Does not include Inmates housed in other detention facilities such as Work Release Centers, County Prisons, etc.)
Jurisdiction
001 APPLING
002 ATKINSON
003 BACON
004 BAKER
NO JAIL
005 BALDWIN
006 BANKS
007 BARROW
008 BARTOW
009 BEN HILL
010 BERRIEN
011 BIBB
012 BLECKLEY
013 BRANTLEY
014 BROOKS
015 BRYAN
016 BULLOCH
017 BURKE
018 BUTTS
019 CALHOUN
020 CAMDEN
021 CANDLER
022 CARROLL
023 CATOOSA
024 CHARLTON
NO JAIL
025 CHATHAM
026 CHATTAHOOCHEE NO JAIL
027 CHATTOOGA
028 CHEROKEE
029 CLARKE
030 CLAY
NO JAIL
031 CLAYTON
032 CLINCH
033 COBB
034 COFFEE
035 COLQUITT
036 COLUMBIA
037 COOK
038 COWETA
039 CRAWFORD
040 CRISP
041 DADE
042 DAWSON
Total Number
of Inmates In Jail
80 16 60 0 158 33 225 508 82 83 946 25 134 84 51 350 88 75 20 126 32 1002 230 0 1492 0 94 526 427 0 1379 23 1682 203 215 239 97 293 17 234 52 127
Jail Capacity
84 18 68 0 316 60 391 471 136 69 966 72 124 112 68 387 138 316 42 108 72 682 248 0 1524 0 93 512 447 0 1920 26 1925 448 210 266 108 300 24 170 99 200
Inmates as % of Capacity
95% 89% 88% 0% 50% 55% 58% 108% 60% 120% 98% 35% 108% 75% 75% 90% 64% 24% 48% 117% 44% 147% 93% 0% 98% 0% 101% 103% 96% 0% 72% 88% 87% 45% 102% 90% 90% 98% 71% 138% 53% 64%
Number of Inmates Sentenced to State
Number
10 0 2 0 1 1 14 48 3 0 40 0 19 5 2 22 1 1 3 3 4 46 30 0 55 0 0 9 42 0 724 7 160 16 5 14 2 22 4 26 1 3
% of Total
13% 0% 3% 0% 1% 3% 6% 9% 4% 0% 4% 0% 14% 6% 4% 6% 1% 1% 15% 2% 13% 5% 13% 0% 4% 0% 0% 2% 10% 0% 53% 30% 10% 8% 2% 6% 2% 8% 24% 11% 2% 2%
Number of Inmates Awaiting Trial in Jail
Number
42 16 38 0 23 21 159 230 65 0 503 25 65 59 48 234 55 51 11 113 20 840 170 0 1302 0 87 433 296 0 484 16 1230 121 139 188 31 160 9 112 33 41
% of Total
53% 100% 63%
0% 15% 64% 71% 45% 79% 0% 53% 100% 49% 70% 94% 67% 63% 68% 55% 90% 63% 84% 74% 0% 87% 0% 93% 82% 69% 0% 35% 70% 73% 60% 65% 79% 32% 55% 53% 48% 63% 32%
Number of Inmates Serving County Sentence
Number
6 0 13 0 51 0 45 197 5 69 57 0 9 14 1 70 3 19 5 4 7 70 15 0 76 0 1 84 85 0 144 0 292 25 42 31 38 106 2 11 14 80
% of Total
8% 0% 22% 0% 32% 0% 20% 39% 6% 83% 6% 0% 7% 17% 2% 20% 3% 25% 25% 3% 22% 7% 7% 0% 5% 0% 1% 16% 20% 0% 10% 0% 17% 12% 20% 13% 39% 36% 12% 5% 27% 63%
Number of Other Inmates
Number
22 0 7 0 83 11 7 33 9 14 346 0 41 6 0 24 29 4 1 6 1 46 15 0 59 0 6 0 4 0 27 0 0 41 29 6 26 5 2 85 4 3
% of Total
28% 0% 12% 0% 53% 33% 3% 6% 11% 17% 37% 0% 31% 7% 0% 7% 33% 5% 5% 5% 3% 5% 7% 0% 4% 0% 6% 0% 1% 0% 2% 0% 0% 20% 13% 3% 27% 2% 12% 36% 8% 2%
County Jail Report
Primary Jail Capacity Data December 2014
(Does not include Inmates housed in other detention facilities such as Work Release Centers, County Prisons, etc.)
Jurisdiction
043 DECATUR
044 DEKALB
045 DODGE
046 DOOLY
047 DOUGHERTY
048 DOUGLAS
049 EARLY
050 ECHOLS
NO JAIL
051 EFFINGHAM
052 ELBERT
053 EMANUEL
054 EVANS
055 FANNIN
056 FAYETTE
057 FLOYD
058 FORSYTH
059 FRANKLIN
060 FULTON
061 GILMER
062 GLASCOCK
NO JAIL
063 GLYNN
064 GORDON
065 GRADY
066 GREENE
067 GWINNETT
068 HABERSHAM
069 HALL
070 HANCOCK
071 HARALSON
072 HARRIS
073 HART
074 HEARD
075 HENRY
076 HOUSTON
077 IRWIN
078 JACKSON
079 JASPER
080 JEFFDAVIS/HAZ
081 JEFFERSON
082 JENKINS
083 JOHNSON
084 JONES
Total Number
of Inmates In Jail
79 2389
96 45 1043 713 42 0 116 70 76 18 62 238 615 176 66 2512 63 0 366 225 99 32 2765 85 821 12 76 78 66 39 636 430 637 119 41 33 68 19 22 107
Inmates Jail as % of
Capacity Capacity
175
45%
3636
66%
72
133%
155
29%
1230
85%
1500
48%
66
64%
0
0%
130
89%
96
73%
102
75%
26
69%
84
74%
384
62%
838
73%
227
78%
72
92%
2688
93%
142
44%
0
0%
565
65%
376
60%
125
79%
125
26%
2744
101%
130
65%
1026
80%
80
15%
120
63%
100
78%
50
132%
60
65%
908
70%
507
85%
1201
53%
452
26%
64
64%
64
52%
128
53%
24
79%
42
52%
125
86%
Number of Inmates Sentenced to State
Number
6 129
1 6 72 59 0 0 4 5 6 5 2 14 25 59 11 114 5 0 28 9 30 15 229 4 28 0 6 1 5 6 24 29 1 3 0 0 10 0 2 5
% of Total
8% 5% 1% 13% 7% 8% 0% 0% 3% 7% 8% 28% 3% 6% 4% 34% 17% 5% 8% 0% 8% 4% 30% 47% 8% 5% 3% 0% 8% 1% 8% 15% 4% 7% 0% 3% 0% 0% 15% 0% 9% 5%
Number of Inmates Awaiting Trial in Jail
Number
60 1840
88 33 505 498 29 0 93 35 39 13 54 185 413 91 32 2051 49 0 225 109 3 10 1550 71 458 11 54 56 54 17 175 311 23 78 30 13 7 17 17 58
% of Total
76% 77% 92% 73% 48% 70% 69% 0% 80% 50% 51% 72% 87% 78% 67% 52% 48% 82% 78% 0% 61% 48% 3% 31% 56% 84% 56% 92% 71% 72% 82% 44% 28% 72% 4% 66% 73% 39% 10% 89% 77% 54%
Number of Inmates Serving County Sentence
Number
13 324
2 3 143 141 5 0 11 11 1 0 1 39 164 25 22 102 3 0 25 90 43 3 83 4 254 1 11 1 2 8 437 88 0 21 8 20 31 2 2 14
% of Total
16% 14% 2% 7% 14% 20% 12% 0% 9% 16% 1% 0% 2% 16% 27% 14% 33% 4% 5% 0% 7% 40% 43% 9% 3% 5% 31% 8% 14% 1% 3% 21% 69% 20% 0% 18% 20% 61% 46% 11% 9% 13%
Number of Other Inmates
Number % of Total
0
0%
96
4%
5
5%
3
7%
323
31%
15
2%
8
19%
0
0%
8
7%
19
27%
30
39%
0
0%
5
8%
0
0%
13
2%
1
1%
1
2%
245
10%
6
10%
0
0%
88
24%
17
8%
23
23%
4
13%
903
33%
6
7%
81
10%
0
0%
5
7%
20
26%
5
8%
8
21%
0
0%
2
0%
613
96%
17
14%
3
7%
0
0%
20
29%
0
0%
1
5%
30
28%
County Jail Report
Primary Jail Capacity Data December 2014
(Does not include Inmates housed in other detention facilities such as Work Release Centers, County Prisons, etc.)
Jurisdiction
085 LAMAR
086 LANIER
NO JAIL
087 LAURENS
088 LEE
089 LIBERTY
090 LINCOLN
091 LONG
NO JAIL
092 LOWNDES
093 LUMPKIN
094 MCDUFFIE
095 MCINTOSH
096 MACON
097 MADISON
098 MARION
099 MERIWETHER
100 MILLER
101 MITCHELL
102 MONROE
103 MONTGOMERY
NO JAIL
104 MORGAN
105 MURRAY
106 MUSCOGEE
107 NEWTON
108 OCONEE
109 OGLETHORPE
110 PAULDING
111 PEACH
112 PICKENS
113 PIERCE
114 PIKE
115 POLK
116 PULASKI
117 PUTNAM
118 QUITMAN
NO JAIL
119 RABUN
120 RANDOLPH
121 RICHMOND
122 ROCKDALE
123 SCHLEY
124 SCREVEN
125 SEMINOLE
126 SPALDING
Total Number
of Inmates In Jail
76 0 162 98 193 38 0 649 117 90 60 24 78 13 71 34 65 53 0 83 81 1153 429 29 34 180 63 77 70 21 141 44 86 0 56 59 934 377 3 44 38 358
Inmates Jail as % of
Capacity Capacity
158
48%
0
0%
270
60%
112
88%
300
64%
81
47%
0
0%
920
71%
150
78%
222
41%
114
53%
68
35%
64
122%
30
43%
106
67%
70
49%
116
56%
168
32%
0
0%
192
43%
120
68%
1069
108%
600
72%
136
21%
64
53%
299
60%
72
88%
140
55%
72
97%
34
62%
362
39%
42
105%
120
72%
0
0%
102
55%
121
49%
910
103%
692
54%
12
25%
247
18%
54
70%
547
65%
Number of Inmates Sentenced to State
Number
0 0 9 7 8 0 0 51 21 5 0 0 10 0 3 1 6 3 0 0 9 38 61 5 5 10 2 2 2 0 2 6 3 0 2 0 39 10 2 2 11 14
% of Total
0% 0% 6% 7% 4% 0% 0% 8% 18% 6% 0% 0% 13% 0% 4% 3% 9% 6% 0% 0% 11% 3% 14% 17% 15% 6% 3% 3% 3% 0% 1% 14% 3% 0% 4% 0% 4% 3% 67% 5% 29% 4%
Number of Inmates Awaiting Trial in Jail
Number
1 0 143 56 119 4 0 458 41 49 44 23 40 7 63 15 36 44 0 65 50 899 278 21 25 138 55 69 63 21 43 38 52 0 38 41 725 322 1 27 11 292
% of Total
1% 0% 88% 57% 62% 11% 0% 71% 35% 54% 73% 96% 51% 54% 89% 44% 55% 83% 0% 78% 62% 78% 65% 72% 74% 77% 87% 90% 90% 100% 30% 86% 60% 0% 68% 69% 78% 85% 33% 61% 29% 82%
Number of Inmates Serving County Sentence
Number
29 0 3 35 19 7 0 120 15 8 4 1 9 4 0 16 19 4 0 10 22 107 68 0 4 22 3 5 2 0 3 0 19 0 12 18 54 17 0 12 10 45
% of Total
38% 0% 2% 36% 10% 18% 0% 18% 13% 9% 7% 4% 12% 31% 0% 47% 29% 8% 0% 12% 27% 9% 16% 0% 12% 12% 5% 6% 3% 0% 2% 0% 22% 0% 21% 31% 6% 5% 0% 27% 26% 13%
Number of Other Inmates
Number % of Total
46
61%
0
0%
7
4%
0
0%
47
24%
27
71%
0
0%
20
3%
40
34%
28
31%
12
20%
0
0%
19
24%
2
15%
5
7%
2
6%
4
6%
2
4%
0
0%
8
10%
0
0%
109
9%
22
5%
3
10%
0
0%
10
6%
3
5%
1
1%
3
4%
0
0%
93
66%
0
0%
12
14%
0
0%
4
7%
0
0%
116
12%
28
7%
0
0%
3
7%
6
16%
7
2%
County Jail Report
Primary Jail Capacity Data December 2014
(Does not include Inmates housed in other detention facilities such as Work Release Centers, County Prisons, etc.)
Jurisdiction
127 STEPHENS
128 STEWART
129 SUMTER
130 TALBOT
131 TALIAFERO
NO JAIL
132 TATTNALL
133 TAYLOR
134 TELFAIR
135 TERRELL
136 THOMAS
137 TIFT
138 TOOMBS
139 TOWNS
140 TREUTLEN
141 TROUP
142 TURNER
143 TWIGGS
144 UNION
145 UPSON
146 WALKER
147 WALTON
148 WARE
149 WARREN
NO JAIL
150 WASHINGTON
151 WAYNE
152 WEBSTER
NO JAIL
153 WHEELER
154 WHITE
155 WHITFIELD
156 WILCOX
157 WILKES
158 WILKINSON
159 WORTH
Grand Totals
Total Number
of Inmates In Jail
105 0
150 9 0 57 33 30 17
199 166 104 12 23 371 54 16 60 100 232 310 354
0 60 153 0 8 86 380 18 30 27 67 36,115
Inmates Jail as % of
Capacity Capacity
192
55%
14
0%
262
57%
22
41%
0
0%
136
42%
62
53%
36
83%
55
31%
270
74%
260
64%
128
81%
50
24%
42
55%
540
69%
102
53%
48
33%
57
105%
213
47%
225
103%
440
70%
500
71%
0
0%
52
115%
170
90%
0
0%
18
44%
176
49%
551
69%
16
113%
80
38%
44
61%
46
146%
47,622 76%
Number of Inmates Sentenced to State
Number % of Total
10 0 6 0 0 1 4 2 0 5 15 10 2 2 22 0 0 30 11 50 47 2 0 9 26 0 0 1 8 4 3 2 9 2,933
10% 0% 4% 0% 0% 2% 12% 7% 0% 3% 9% 10% 17% 9% 6% 0% 0% 50% 11% 22% 15% 1% 0% 15% 17% 0% 0% 1% 2% 22% 10% 7% 13% 8%
Number of Inmates Awaiting Trial in Jail
Number % of Total
72 0 110 8 0 32 20 16 13 167 22 89 5 8 275 0 0 26 70 137 148 234 0 0 124 0 5 75 341 13 12 18 54 23,436
69% 0% 73% 89% 0% 56% 61% 53% 76% 84% 13% 86% 42% 35% 74% 0% 0% 43% 70% 59% 48% 66% 0% 0% 81% 0% 63% 87% 90% 72% 40% 67% 81% 65%
Number of Inmates Serving County Sentence
Number % of Total
5 0 1 1 0 8 4 1 1 22 119 3 4 6 42 28 15 4 10 30 83 59 0 5 0 0 0 8 21 0 12 0 4 5,071
5% 0% 1% 11% 0% 14% 12% 3% 6% 11% 72% 3% 33% 26% 11% 52% 94% 7% 10% 13% 27% 17% 0% 8% 0% 0% 0% 9% 6% 0% 40% 0% 6% 14%
Number of Other Inmates
Number % of Total
18 0 33 0 0 16 5 11 3 5 10 2 1 7 32 26 1 0 9 15 32 59 0 46 3 0 3 2 10 1 3 7 0 4,675
17% 0% 22% 0% 0% 28% 15% 37% 18% 3% 6% 2% 8% 30% 9% 48% 6% 0% 9% 6% 10% 17% 0% 77% 2% 0% 38% 2% 3% 6% 10% 26% 0% 13%