- Collection:
- Georgia Government Publications
- Serial:
- County jail inmate population report.
- Title:
- County jail inmate population report, 2011 September
- Creator:
- Georgia. Department of Community Affairs. Office of Research
Georgia Crime Information Center
Georgia Sheriffs Association
Association County Commissioners of Georgia - Contributor to Resource:
- Georgia. Department of Community Affairs
- Publisher:
- Atlanta, Ga. : Georgia. Department of Community Affairs. Office of Research
- Date of Original:
- 2011-09
- Subject:
- Jails--Georgia--Statistics--Periodicals
Prisons--Géorgie (État)--Statistiques--Périodiques
Jails - Location:
- United States, Georgia, 32.75042, -83.50018
- Medium:
- monthlies
monthly reports - Type:
- Text
- Format:
- application/pdf
- Description:
- "Department of Community" in publishing statement appears to refer to Department of Community Affairs.
Some issues from Georgia Government Publications Database may include cover letters containing alternate titles. July 5, 2001 issue from Georgia Government Publications Database includes cover letter including alternate titles and a chart called: Profile of county jails: capacity. December 2, 1999-May 4, 2000 from Georgia Government Publications Database includes section at beginning called: Statistical data on county jails, January 1990-December 1999.
Volumes for July 2009- issued by Georgia Department of Community Affairs, Office of Research.
Description based on: June 3, 1999; title from PDF caption (GALILEO, viewed February 20, 2018).
Latest issue consulted: May 7, 2020 (publisher's Web site, viewed June 15, 2020). - External Identifiers:
- Call Number GA C495 .P1 J3 2011/9
- Metadata URL:
- https://dlg.galileo.usg.edu/id:dlg_ggpd_i-ga-bc495-b-pp1-bj3-b2011-s9-belec-p-btext
- Digital Object URL:
- https://dlg.galileo.usg.edu/do:dlg_ggpd_i-ga-bc495-b-pp1-bj3-b2011-s9-belec-p-btext
- Language:
- eng
- Holding Institution:
- University of Georgia. Map and Government Information Library
- Rights:
-

Georgia Department of Community Affairs Office of Research
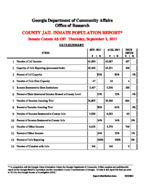
COUNTY JAIL INMATE POPULATION REPORT*
Inmate Counts AS OF: Thursday, September 2, 2011
ITEM
DATA SUMMARY
SEP. 2011
# |%
AUG. 2011
# |%
INCR /DECR
# |%
1 Number of Jail Inmates
41,930
42,097
-167
2 Capacity of Jails Reporting (permanent beds)
45,460
45,351
109
3 Percent of Jail Capacity
92%
93%
-1%
4 Number of Jails Over Capacity
47
43
4
5 Inmates Sentenced to State Institutions
5,167
5,356
-189
6 Percent of State-Sentenced Inmates Housed at County Level
12%
13%
-1%
7 Number of Inmates Awaiting Trial
24,805
25,469
-664
8 Percent of Inmates Awaiting Trial
59%
61%
-2%
9 Number of Inmates Sentenced to County Jails
5,939
6,002
-63
10 Percent of Inmates Sentenced to County Jails
14%
14%
0%
11 Number of Other Inmates
6,019
5,270
749
12 Percent of Other Inmates
14%
13%
1%
13 Percent of Jails Reporting
100%
100%
0%
14 Number of Counties with Jails
146
146
0
"* In cooperation with the Georgia Crime Information Center, the Georgia Department of Community Affairs compiles and publishes this report for the Georgia Sheriff's Association and the Association County Commissioners of Georgia. All data in this report has been provided to DCA by the Georgia Bureau of Investigation (GBI)."
Report Distribution Date:
9/23/2011
Georgia Department of Community Affairs Office of Research
Jail Composition September 2011
6,019, 15%
Inmates Awaiting Trial
5,939, 14% 5,167, 12%
24,805, 59%
Inmates Sentenced to State Institutions County Sentenced Inmates
Other Inmates
Source: All data in this report has been provided to DCA by the Georgia Bureau of Investigation (GBI).
Georgia Department of Community Affairs Office of Research
COUNTY JAIL CAPACITY - ANNUAL TREND Jan 2001 to Jan 2011
50,000 47,500 45,000 42,500 40,000 37,500 35,000 32,500 30,000 27,500 25,000
30,837
32,341
33,426
35,152
36,857
37,807
39,747
41,553
42,228
44,897
45,212
Jan Jan Jan Jan Jan Jan Jan Jan Jan Jan Jan 2001 2002 2003 2004 2005 2006 2007 2008 2009 2010 2011
COUNTY JAIL CAPACITY - LAST 12 MONTHS
44,897 44,897 44,883
45,212 45,309 45,351 45,351 45,351 45,351 45,351 45,351
45,460
45,500 45,250 45,000 44,750 44,500 44,250 44,000 43,750 43,500 43,250 43,000 42,750 42,500 42,250 42,000 41,750 41,500 41,250
Oct Nov Dec Jan Feb Mar Apr May Jun Jul 11 Aug Sep
10 10 10 11 11 11 11 11 11
11 11
Source: All data in this report has been provided to DCA by the Georgia Bureau of Investigation (GBI).
Georgia Department of Community Affairs Office of Research
50,000 47,500 45,000 42,500 40,000 37,500 35,000 32,500 30,000 27,500 25,000 22,500 20,000
JAIL POPULATION - ANNUAL TREND Jan 2001 - Jan 2011
27,025
28,638
29,371
31,797
33,198
37,335
36,069
36,984
39,919
38,803
40,648
Jan Jan Jan Jan Jan Jan Jan Jan Jan Jan Jan 2001 2002 2003 2004 2005 2006 2007 2008 2009 2010 2011
JAIL POPULATION - Last 12 Months
50,000
47,500
45,000
44,249 42,337 41,568 40,648 42,226 41,628 41,833 41,835 41,676 42,214 42,097 41,930
42,500
40,000
37,500
35,000
32,500
30,000
27,500
25,000
Oct Nov Dec Jan Feb Mar Apr May Jun Jul 11 Aug Sep
10 10 10 11 11 11 11 11 11
11 11
Source: All data in this report has been provided to DCA by the Georgia Bureau of Investigation (GBI).
Georgia Department of Community Affairs Office of Research
50,000 45,000 40,000 35,000 30,000 25,000 20,000 15,000 10,000
30,837
Jan 2001
27,025
32,341
28,638
33,426
29,371
35,152
31,797
36,857
33,198
37,807
JAIL CAPACITY VS INMATE POPULATION - ANNUAL TREND Jan 2001 - Jan 2011
Jan Jan Jan Jan Jan Jan Jan Jan Jan 2002 2003 2004 2005 2006 2007 2008 2009 2010
37,335
39,747
36,069
41,553
36,984
42,228
39,919
44,897
38,803
45,212
Jan 2011
CAPACITY
INMATES
40,648
44,249 42,337 41,568 40,648 42,226 41,628 41,833 41,835 41,676 42,214 42,097 41,930
JAIL CAPACITY VS INMATE POPULATION - LAST 12 MONTHS
44,897 44,897 44,883 45,212 45,309 45,351 45,351 45,351 45,351 45,351 45,351 45,460
50,000
45,000
40,000
35,000
30,000
25,000
Oct 10 Nov Dec Jan 11Feb 11Mar 11 Apr 11 May Jun 11 Jul 11 Aug Sep
10 10
11
11 11
CAPACITY
INMATES
Source: All data in this report has been provided to DCA by the Georgia Bureau of Investigation (GBI).
Georgia Department of Community Affairs Office of Research
7,000 6,500 6,000 5,500 5,000 4,500 4,000 3,500 3,000 2,500 2,000 1,500 1,000
2,417
Jan 2001
INMATES SENTENCED TO STATE - ANNUAL TREND Jan 2001 - Jan 2011
3,201
3,497
4,855
4,486
4,325
3,508
3,278
5,277
5,073
Jan Jan Jan Jan Jan Jan Jan Jan Jan 2002 2003 2004 2005 2006 2007 2008 2009 2010
5,994
Jan 2011
INMATES SENTENCED TO STATE - Last 12 Months
7,000
5,746 6,384
6,118 5,994 5,969 6,173
6,281 6,084 6,122 6,135 5,356 5,167
6,000
5,000
4,000
3,000
2,000
1,000
Oct 10 Nov Dec Jan Feb Mar Apr 11 May Jun Jul 11 Aug Sep
10 10 11 11 11
11 11
11 11
Source: All data in this report has been provided to DCA by the Georgia Bureau of Investigation (GBI).
Georgia Department of Community Affairs Office of Research
25,000 24,000 23,000 22,000 21,000 20,000 19,000 18,000 17,000 16,000 15,000
INMATES AWAITING TRIAL IN JAIL - ANNUAL TREND Jan 2001 - Jan 2011
23,956
24,216
23,136
23,345
22,059 22,495
20,288 19,411
16,806 17,207 17,579
Jan Jan Jan Jan Jan Jan Jan Jan Jan Jan Jan 2001 2002 2003 2004 2005 2006 2007 2008 2009 2010 2011
INMATES AWAITING TRIAL IN JAIL - Last 12 Months
26,000
24,728 24,783 24,464 24,216
25,264 24,205 23,897
24,827 25,330 24,718
25,469 24,805
25,000
24,000
23,000
22,000
21,000
20,000
19,000
18,000
17,000
16,000
15,000
Oct 10 Nov Dec Jan Feb Mar Apr 11 May Jun Jul 11 Aug Sep
10 10 11 11 11
11 11
11 11
Source: All data in this report has been provided to DCA by the Georgia Bureau of Investigation (GBI).
County Jail Report
Primary Jail Capacity Data September 2011
(Does not include Inmates housed in other detention facilities such as Work Release Centers, County Prisons, etc.)
Jurisdiction
001 APPLING
002 ATKINSON
003 BACON
004 BAKER
NO JAIL
005 BALDWIN
006 BANKS
007 BARROW
008 BARTOW
009 BEN HILL
010 BERRIEN
011 BIBB
012 BLECKLEY
013 BRANTLEY
014 BROOKS
015 BRYAN
016 BULLOCH
017 BURKE
018 BUTTS
019 CALHOUN
020 CAMDEN
021 CANDLER
022 CARROLL
023 CATOOSA
024 CHARLTON
NO JAIL
025 CHATHAM
026 CHATTAHOOCHEE NO JAIL
027 CHATTOOGA
028 CHEROKEE
029 CLARKE
030 CLAY
NO JAIL
031 CLAYTON
032 CLINCH
033 COBB
034 COFFEE
035 COLQUITT
036 COLUMBIA
037 COOK
038 COWETA
039 CRAWFORD
040 CRISP
041 DADE
042 DAWSON
Total Number
of Inmates In Jail
99 17 68 0 258 38 301 664 137 100 984 42 157 106 55 332 140 133 18 169 57 492 212 0 1805 0 93 535 485 0 1667 35 2097 373 243 334 117 283 17 157 58 154
Jail Capacity
84 18 68 0 316 60 391 471 136 69 966 72 124 112 68 387 138 316 42 188 72 682 248 0 1524 0 93 512 447 0 1920 26 1925 218 210 266 108 300 24 170 99 200
Inmates as % of Capacity 118%
94% 100%
0% 82% 63% 77% 141% 101% 145% 102% 58% 127% 95% 81% 86% 101% 42% 43% 90% 79% 72% 85% 0% 118% 0% 100% 104% 109% 0% 87% 135% 109% 171% 116% 126% 108% 94% 71% 92% 59% 77%
Number of Inmates Sentenced to State
Number
34 0 2 0 51 3 35 96 18 13 135 2 12 1 12 45 5 16 5 9 18 52 39 0 142 0 26 88 47 0 327 5 293 19 36 26 29 28 0 38 7 7
% of Total
34% 0% 3% 0% 20% 8% 12% 14% 13% 13% 14% 5% 8% 1% 22% 14% 4% 12% 28% 5% 32% 11% 18% 0% 8% 0% 28% 16% 10% 0% 20% 14% 14% 5% 15% 8% 25% 10% 0% 24% 12% 5%
Number of Inmates Awaiting Trial in Jail
Number
41 12 42 0 96 16 182 268 91 0 413 32 87 88 40 173 97 92 10 152 37 237 136 0 1530 0 66 390 316 0 665 29 1568 304 150 248 16 160 14 83 39 75
% of Total
41% 71% 62% 0% 37% 42% 60% 40% 66% 0% 42% 76% 55% 83% 73% 52% 69% 69% 56% 90% 65% 48% 64% 0% 85% 0% 71% 73% 65% 0% 40% 83% 75% 82% 62% 74% 14% 57% 82% 53% 67% 49%
Number of Inmates Serving County Sentence
Number
4 0 15 0 69 10 59 255 22 0 54 0 5 9 2 71 6 21 1 3 1 155 24 0 113 0 0 32 118 0 443 0 214 10 40 50 34 83 1 16 10 69
% of Total
4% 0% 22% 0% 27% 26% 20% 38% 16% 0% 5% 0% 3% 8% 4% 21% 4% 16% 6% 2% 2% 32% 11% 0% 6% 0% 0% 6% 24% 0% 27% 0% 10% 3% 16% 15% 29% 29% 6% 10% 17% 45%
Number of Other Inmates
Number
20 5 9 0 42 9 25 45 6 87 382 8 53 8 1 43 32 4 2 5 1 48 13 0 20 0 1 25 4 0 232 1 22 40 17 10 38 12 2 20 2 3
% of Total
20% 29% 13% 0% 16% 24% 8% 7% 4% 87% 39% 19% 34% 8% 2% 13% 23% 3% 11% 3% 2% 10% 6% 0% 1% 0% 1% 5% 1% 0% 14% 3% 1% 11% 7% 3% 32% 4% 12% 13% 3% 2%
County Jail Report
Primary Jail Capacity Data September 2011
(Does not include Inmates housed in other detention facilities such as Work Release Centers, County Prisons, etc.)
Jurisdiction
043 DECATUR
044 DEKALB
045 DODGE
046 DOOLY
047 DOUGHERTY
048 DOUGLAS
049 EARLY
050 ECHOLS
NO JAIL
051 EFFINGHAM
052 ELBERT
053 EMANUEL
054 EVANS
055 FANNIN
056 FAYETTE
057 FLOYD
058 FORSYTH
059 FRANKLIN
060 FULTON
061 GILMER
062 GLASCOCK
NO JAIL
063 GLYNN
064 GORDON
065 GRADY
066 GREENE
067 GWINNETT
068 HABERSHAM
069 HALL
070 HANCOCK
071 HARALSON
072 HARRIS
073 HART
074 HEARD
075 HENRY
076 HOUSTON
077 IRWIN
078 JACKSON
079 JASPER
080 JEFFDAVIS/HAZ
081 JEFFERSON
082 JENKINS
083 JOHNSON
084 JONES
Total Number
of Inmates In Jail
106 3369
84 101 955 745 35
0 148 70 118
7 81 305 719 203 72 2928 115 0 468 295 140 72 2585 108 1026 24 89 84 51 44 709 533 391 226 46 63 132 23 32 127
Inmates Jail as % of Capacity Capacity
175
61%
3636
93%
72
117%
155
65%
1230
78%
485
154%
66
53%
0
0%
130
114%
96
73%
102
116%
26
27%
84
96%
384
79%
838
86%
227
89%
72
100%
2688
109%
142
81%
0
0%
565
83%
376
78%
125
112%
125
58%
2744
94%
130
83%
1026
100%
80
30%
120
74%
100
84%
50
102%
60
73%
908
78%
507
105%
1201
33%
452
50%
64
72%
64
98%
128
103%
24
96%
42
76%
125
102%
Number of Inmates Sentenced to State
Number
24 181 11 15 129 90
4 0 35 39 20 0 7 28 124 63 5 47 22 0 91 44 22 39 386 16 90 2 7 4 7 9 90 74 8 27 3 6 25 3 9 36
% of Total
23% 5% 13% 15% 14% 12% 11% 0% 24% 56% 17% 0% 9% 9% 17% 31% 7% 2% 19% 0% 19% 15% 16% 54% 15% 15% 9% 8% 8% 5% 14% 20% 13% 14% 2% 12% 7% 10% 19% 13% 28% 28%
Number of Inmates Awaiting Trial in Jail
Number
72 2595
69 37 646 485 31 0 99 18 61 7 71 245 344 108 44 1917 85 0 278 89 53 24 761 65 349 21 61 54 39 25 262 361 28 171 24 50 56 13 8 53
% of Total
68% 77% 82% 37% 68% 65% 89% 0% 67% 26% 52% 100% 88% 80% 48% 53% 61% 65% 74% 0% 59% 30% 38% 33% 29% 60% 34% 88% 69% 64% 76% 57% 37% 68% 7% 76% 52% 79% 42% 57% 25% 42%
Number of Inmates Serving County Sentence
Number % of Total
8
8%
459
14%
4
5%
0
0%
154
16%
162
22%
0
0%
0
0%
11
7%
5
7%
6
5%
0
0%
1
1%
31
10%
180
25%
32
16%
19
26%
228
8%
6
5%
0
0%
19
4%
137
46%
30
21%
0
0%
160
6%
13
12%
200
19%
1
4%
21
24%
3
4%
5
10%
10
23%
357
50%
97
18%
1
0%
19
8%
10
22%
3
5%
6
5%
4
17%
6
19%
10
8%
Number of Other Inmates
Number % of Total
2 134
0 49 26 8 0 0 3 8 31 0 2 1 71 0 4 736 2 0 80 25 35 9 1278 14 387 0 0 23 0 0 0 1 354 9 9 4 45 3 9 28
2% 4% 0% 49% 3% 1% 0% 0% 2% 11% 26% 0% 2% 0% 10% 0% 6% 25% 2% 0% 17% 8% 25% 13% 49% 13% 38% 0% 0% 27% 0% 0% 0% 0% 91% 4% 20% 6% 34% 13% 28% 22%
County Jail Report
Primary Jail Capacity Data September 2011
(Does not include Inmates housed in other detention facilities such as Work Release Centers, County Prisons, etc.)
Jurisdiction
085 LAMAR
086 LANIER
NO JAIL
087 LAURENS
088 LEE
089 LIBERTY
090 LINCOLN
091 LONG
NO JAIL
092 LOWNDES
093 LUMPKIN
094 MCDUFFIE
095 MCINTOSH
096 MACON
097 MADISON
098 MARION
099 MERIWETHER
100 MILLER
101 MITCHELL
102 MONROE
103 MONTGOMERY
NO JAIL
104 MORGAN
105 MURRAY
106 MUSCOGEE
107 NEWTON
108 OCONEE
109 OGLETHORPE
110 PAULDING
111 PEACH
112 PICKENS
113 PIERCE
114 PIKE
115 POLK
116 PULASKI
117 PUTNAM
118 QUITMAN
NO JAIL
119 RABUN
120 RANDOLPH
121 RICHMOND
122 ROCKDALE
123 SCHLEY
124 SCREVEN
125 SEMINOLE
126 SPALDING
Total Number
of Inmates In Jail
78 0 251 75 239 68 0 742 169 180 75 30 81 30 126 66 114 114 0 76 137 1211 660 48 48 314 99 94 59 39 180 34 105 0 76 27 861 496 7 114 45 445
Inmates Jail as % of Capacity Capacity
158
49%
0
0%
270
93%
112
67%
300
80%
81
84%
0
0%
620
120%
150
113%
222
81%
114
66%
68
44%
64
127%
30
100%
106
119%
70
94%
116
98%
168
68%
0
0%
192
40%
120
114%
1069
113%
600
110%
136
35%
64
75%
299
105%
72
138%
140
67%
72
82%
34
115%
362
50%
42
81%
120
88%
0
0%
102
75%
32
84%
910
95%
692
72%
12
58%
176
65%
54
83%
547
81%
Number of Inmates Sentenced to State
Number
6 0 9 19 41 10 0 49 31 37 7 1 5 1 16 5 33 7 0 5 20 140 243 14 4 18 8 15 3 2 12 3 16 0 3 3 73 95 3 18 13 56
% of Total
8% 0% 4% 25% 17% 15% 0% 7% 18% 21% 9% 3% 6% 3% 13% 8% 29% 6% 0% 7% 15% 12% 37% 29% 8% 6% 8% 16% 5% 5% 7% 9% 15% 0% 4% 11% 8% 19% 43% 16% 29% 13%
Number of Inmates Awaiting Trial in Jail
Number
34 0 197 33 124 11 0 587 53 91 37 23 49 25 78 8 54 91 0 54 78 770 283 14 38 196 40 65 55 29 25 27 61 0 39 20 624 310 4 57 16 331
% of Total
44% 0% 78% 44% 52% 16% 0% 79% 31% 51% 49% 77% 60% 83% 62% 12% 47% 80% 0% 71% 57% 64% 43% 29% 79% 62% 40% 69% 93% 74% 14% 79% 58% 0% 51% 74% 72% 63% 57% 50% 36% 74%
Number of Inmates Serving County Sentence
Number % of Total
8
10%
0
0%
26
10%
21
28%
28
12%
7
10%
0
0%
85
11%
7
4%
6
3%
0
0%
0
0%
3
4%
4
13%
24
19%
16
24%
23
20%
13
11%
0
0%
10
13%
39
28%
168
14%
82
12%
13
27%
4
8%
54
17%
29
29%
6
6%
0
0%
4
10%
18
10%
1
3%
21
20%
0
0%
17
22%
4
15%
32
4%
75
15%
0
0%
10
9%
4
9%
54
12%
Number of Other Inmates
Number % of Total
30
38%
0
0%
19
8%
2
3%
46
19%
40
59%
0
0%
21
3%
78
46%
46
26%
31
41%
6
20%
24
30%
0
0%
8
6%
37
56%
4
4%
3
3%
0
0%
7
9%
0
0%
133
11%
52
8%
7
15%
2
4%
46
15%
22
22%
8
9%
1
2%
4
10%
125
69%
3
9%
7
7%
0
0%
17
22%
0
0%
132
15%
16
3%
0
0%
29
25%
12
27%
4
1%
County Jail Report
Primary Jail Capacity Data September 2011
(Does not include Inmates housed in other detention facilities such as Work Release Centers, County Prisons, etc.)
Jurisdiction
127 STEPHENS
128 STEWART
129 SUMTER
130 TALBOT
131 TALIAFERO
NO JAIL
132 TATTNALL
133 TAYLOR
134 TELFAIR
135 TERRELL
136 THOMAS
137 TIFT
138 TOOMBS
139 TOWNS
140 TREUTLEN
141 TROUP
142 TURNER
143 TWIGGS
144 UNION
145 UPSON
146 WALKER
147 WALTON
148 WARE
149 WARREN
NO JAIL
150 WASHINGTON
151 WAYNE
152 WEBSTER
NO JAIL
153 WHEELER
154 WHITE
155 WHITFIELD
156 WILCOX
157 WILKES
158 WILKINSON
159 WORTH Grand Totals
Total Number
of Inmates In Jail
140 0
213 16 0 75 24 28 36 218 212 119 26 44 364 30 30 93 144 257 433 406 0 68 174 0 22 56 442 46 43 47 50 41,930
Jail Capacity
192 14 262 22 0 46 27 36 55 270 260 128 50 42 240 102 48 57 213 225 440 500 0 52 170 0 18 64 551 16 80 44 46 45,460
Inmates as % of Capacity
73% 0% 81% 73% 0% 163% 89% 78% 65% 81% 82% 93% 52% 105% 152% 29% 63% 163% 68% 114% 98% 81% 0% 131% 102% 0% 122% 88% 80% 288% 54% 107% 109% 92%
Number of Inmates Sentenced to State
Number % of Total
24 0 25 1 0 16 9 3 9 12 31 38 4 11 70 0 0 52 8 35 88 16 0 15 11 0 2 6 35 16 6 8 9 5,167
17% 0% 12% 6% 0% 21% 38% 11% 25% 6% 15% 32% 15% 25% 19% 0% 0% 56% 6% 14% 20% 4% 0% 22% 6% 0% 9% 11% 8% 35% 14% 17% 18% 12%
Number of Inmates Awaiting Trial in Jail
Number % of Total
74 0 158 7 0 45 8 24 23 178 46 69 14 16 227 0 0 30 80 212 249 274 0 24 154 0 15 28 338 25 19 26 37 24,805
53% 0% 74% 44% 0% 60% 33% 86% 64% 82% 22% 58% 54% 36% 62% 0% 0% 32% 56% 82% 58% 67% 0% 35% 89% 0% 68% 50% 76% 54% 44% 55% 74% 59%
Number of Inmates Serving County Sentence
Number % of Total
22 0 6 7 0 12 4 0 0 24 118 3 3 3 43 28 28 11 32 10 75 70 0 3 0 0 0 18 47 1 10 4 4 5,939
16% 0% 3% 44% 0% 16% 17% 0% 0% 11% 56% 3% 12% 7% 12% 93% 93% 12% 22% 4% 17% 17% 0% 4% 0% 0% 0% 32% 11% 2% 23% 9% 8% 14%
Number of Other Inmates
Number % of Total
20 0 24 1 0 2 3 1 4 4 17 9 5 14 24 2 2 0 24 0 21 46 0 26 9 0 5 4 22 4 8 9 0 6,019
14% 0% 11% 6% 0% 3% 13% 4% 11% 2% 8% 8% 19% 32% 7% 7% 7% 0% 17% 0% 5% 11% 0% 38% 5% 0% 23% 7% 5% 9% 19% 19% 0% 14%