- Collection:
- Georgia Government Publications
- Serial:
- Georgia weather & crops / Georgia Agricultural Statistics Service.
- Title:
- Georgia weather and crops, 2005 July 10
- Creator:
- Georgia Agricultural Statistics Service
- Contributor to Resource:
- United States. Department of Agriculture
United States. National Agricultural Statistics Service
United States. Extension Service
United States. National Oceanic and Atmospheric Administration
United States. National Weather Service
Georgia. Department of Agriculture - Publisher:
- Athens, Ga. : Georgia Agricultural Statistics Service
- Date of Original:
- 2005-07-10
- Subject:
- Crops and climate--Georgia
Crops and climate--Georgia--Statistics - Location:
- United States, Georgia, 32.75042, -83.50018
- Medium:
- state government records
- Type:
- Text
- Format:
- application/pdf
- Description:
- "USDA-National Agricultural Statistics Service, Cooperative Extension Service, NOAA-National Weather Service, Georgia Department of Agriculture."
- External Identifiers:
- Call Number GA A400.C7 P1 W4 2005/7-10
- Metadata URL:
- https://dlg.galileo.usg.edu/id:dlg_ggpd_i-ga-ba400-pc7-bp1-bw4-b2005-s7-h10-belec-p-btext
- Digital Object URL:
- https://dlg.galileo.usg.edu/do:dlg_ggpd_i-ga-ba400-pc7-bp1-bw4-b2005-s7-h10-belec-p-btext
- Language:
- eng
- Holding Institution:
- University of Georgia. Map and Government Information Library
- Rights:
-

ga-crop-weather
State Georgia Crop Weather
Week Ending Date July 10, 2005
Issue GA-CW2705 Agricultural Summary July 10, 2005
WET WEATHER CONTINUES Storms Cindy and Dennis pummeled most areas, according to the Georgia Agricultural Statistics Service. Up to 4 inches of rain were common throughout the State and some areas received more. Heavy rains coupled with strong winds damaged crops and delayed fieldwork. Soil moisture levels were rated 1 percent very short, 5 percent short, 57 percent adequate, and 37 percent surplus.
Pastures, corn, and grain sorghum continued to improve from the recent rains. Dry weather, early in the week, permitted fertilizing and spraying to control insects and weeds. In east central Georgia, the rains reduced the recent dry conditions. Wet weather conditions and high humidity were causing a rise in diseases for commercial vegetables. Sucker control was applied on tobacco fields, and herbicides and fungicides on cotton and peanuts. Pecan scab and leaf spot appeared in pecans.
County Extension Agents reported an average of 4.4 days suitable for fieldwork. Excessive rains continued to delay hay harvest. Livestock producers have abundance of grass. Other activities included tobacco harvesting, general maintenance of equipment, and the routine care of livestock and poultry.
Crop Progress Table
Corn, Silked Corn, Dough Corn, Dent Soybeans, Planted Soybeans, Emerged Soybeans, Blooming Soybeans, Setting Pods Sorghum, Planted Cotton, Squaring Cotton, Setting Bolls Wheat, Harvested for Grain Peaches, Harvested Peanuts, Blooming Peanuts, Pegging Tobacco, Harvested Watermelons, Harvested
Jul 10, 2005 94 61 14 98 96 25 4 89 82 32 99 54 88 58 10 60
Prev Week 86 36 6 95 89 16 0 85 64 17 94 51 73 38 3 32
Prev Year 97 78 38
100 100
38 9
94 89 41 100 64 90 66 12 83
5 Year Avg 96 78 41 98 94 32 11 95 84 42 99 67 89 63 16 79
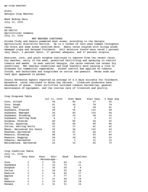
Crop Condition Table
July 10, 2005
Crop
Very Poor
Corn
0
Soybeans
0
Sorghum
1
Cotton
1
Pasture
0
Apples
0
Hay
0
Peanuts
0
Pecans
0
Poor Fair
--Percentage--
2
18
1
16
1
35
2
28
3
14
3
9
1
21
3
19
2
31
Good
65 72 59 55 66 77 64 60 51
Excellent
15 11
4 14 17 11 14 18 16
Tobacco
13
25
40
21
1
Watermelons
3
12
45
38
2
Pasture Condition Table - District* Level
July 10, 2005
Very Poor Poor Fair Good Excellent
--Percentage--
Dist 1(NW)
0
26
21
50
3
Dist 2(NC)
0
0
10
75
15
Dist 3(NE)
0
4
13
77
6
Dist 4(WC)
0
0
12
73
15
Dist 5(C)
0
3
16
56
25
Dist 6(EC)
0
0
4
81
15
Dist 7(SW)
0
3
18
67
12
Dist 8(SC)
0
0
23
45
32
Dist 9(SE)
0
0
9
78
13
*A list of the counties in each of the nine Georgia
Agricultural Statistics Districts is available at
http://www.nass.usda.gov/ga/ctyests/districts.pdf.
Soil Moisture Table
Jul 10, 2005 Prev Year
--Percentages--
Very Short
1
1
Short
5
11
Adequate
57
72
Surplus
37
16
5 Year Avg
9 23 56 12
Soil Moisture Table - District Level
July 10, 2005
Very Short Short Adequate
--Percentages--
Dist 1(NW)
0
3
61
Dist 2(NC)
0
0
49
Dist 3(NE)
0
0
50
Dist 4(WC)
0
13
42
Dist 5(C)
5
8
45
Dist 6(EC)
0
2
80
Dist 7(SW)
0
10
65
Dist 8(SC)
0
6
54
Dist 9(SE)
0
3
64
Surplus
36 51 50 45 42 18 25 40 33
Weather Information Table
GEORGIA WEATHER SUMMARY FOR THE WEEK ENDING MIDNIGHT, SUNDAY
JULY 10, 2005 1/
2005
Air Temperature
Precipitation Totals
Extreme Weekly Rain
30
60
Soil
Location
Max Min AvG Weekly Day Day
Day Season Temp
ALMA
93 70 81 1.65 2
5.73 13.46 29.57 84
ALPHARETTA
91 61 74 2.53 5
4.64 10.10 31.26 79
ARLINGTON
92 68 78 4.52 5
7.11 13.64 35.32 84
ATTAPULGUS
92 65 77 6.96 5
9.92 15.97 42.12 83
BLAIRSVILLE
88 58 71 2.60 5
8.15 12.99 30.97 73
BOWEN
91 69 80 3.07 2
7.55 11.54 35.13 85
BRUNSWICK
93 73 83 0.08 2 10.28 13.61 34.23 83
BYRON
92 68 78 3.52 4
7.06 12.24 29.92 81
CAIRO
92 69 79 5.53 5
8.25 14.42 38.06 80
CALHOUN
90 62 74 2.54 6
9.41 12.16 32.77 78
CLARKS HILL
90 65 77 0.42 3
2.68 8.74 25.49 80
CORDELE
93 67 79 4.29 3
8.33 12.37 34.64 84
COVINGTON
89 66 75 3.36 4
6.23 9.81 24.39 79
DAHLONEGA
87 58 72 2.91 5
8.05 12.42 32.94 75
DALLAS
89 64 74 7.04 6 10.49 13.19 32.77 78
DAWSON
92 68 78 4.26 4
6.17 12.33 30.03 82
DEARING
90 67 77 0.84 3
5.01 12.43 28.01 80
DEMPSEY
89 65 75 5.15 6
8.24 12.06 31.18 78
DIXIE
93 70 80 7.04 4 12.01 16.36 39.08 84
DUBLIN
93 69 79 2.20 2
4.93 8.88 28.25 85
DULUTH
92 62 74 5.18 6
7.61 12.95 31.61 78
DUNWOODY
90 63 74 4.38 6
7.31 12.27 32.14 79
EATONTON
90 59 73 3.35 6
5.94 11.04 28.00 80
ELLIJAY
89 56 72 2.60 5
9.57 15.73 35.74 76
GAINESVILLE
87 64 75 2.87 5
6.30 10.87 29.31 79
GEORGETOWN
92 67 77 4.12 4
8.65 13.85 42.70 81
GRIFFIN
89 67 75 4.65 4
7.69 11.79 31.47 77
HOMERVILLE
94 70 81 1.35 3
7.14 13.21 30.56 85
JACKSONVILLE 91 68 78 2.14 3
3.89 10.58 29.51 82
JONESBORO
91 67 76 5.58 4
7.96 10.94 31.98 79
LAFAYETTE
88 63 74 2.14 6
6.62 12.49 25.54 77
MCRAE
92 66 79 1.21 3
3.57 6.73 24.77 85
MIDVILLE
92 68 79 1.23 2
2.20 8.43 25.81 86
NAHUNTA
95 64 78 1.00 4
6.83 9.41 28.28 84
NEWTON
91 68 78 3.99 5
9.82 13.76 38.66 85
PINE MOUNTAIN 90 65 76 5.10 6
6.85 13.42 35.02 78
PLAINS
92 68 77 6.02 5 10.68 15.92 36.70 82
ROME
90 65 75 1.72 5
4.95 7.41 19.84 78
SAVANNAH
95 74 83 0.64 4
7.19 13.07 29.06 85
SHELLMAN
93 68 78 3.19 4
5.98 10.82 31.43 86
SKIDAWAY
96 72 82 1.14 4
6.46 11.60 30.60 81
STATESBORO
92 49 77 0.90 4
5.60 11.10 29.35 85
TIFTON
89 69 79 4.11 4
8.07 13.06 30.62 81
TIGER
87 56 72 2.95 5 10.57 20.27 39.96 78
VALDOSTA
95 73 82 4.26 4
9.30 17.72 39.85 84
VIDALIA
94 69 81 1.85 2
3.53 6.40 18.68 85
WATKINSVILLE 83 50 65 4.33 5 12.48 17.34 39.74 79
WILLIAMSON
90 65 75 3.38 5
4.94 8.19 28.62 80
1/ Weather data supplied by Georgia Automated Environmental Monitoring
Network (AEMN) and the office of the State Climatologist, University of
Georgia. For detailed Georgia weather data visit the AEMN homepage,
www.georgiaweather.net. NA - not available.
District Highlights These comments are written by the Georgia County Extension Agents, and have been compiled and edited by the Georgia Agricultural Statistics Service.
DISTRICT 1 - NORTHWEST A wet week with over 3 inches of rain since Monday.
DISTRICT 2 - NORTH CENTRAL Excessive rains late in the week.
Three inches of rain fell in many sections of the county and more is expected - no field work possible.
DISTRICT 3 - NORTHEAST Rainfall hampering hay harvest.
DISTRICT 4 - WEST CENTRAL Rainfall amounts ranged from 0.75 - 1.5 inches this past week. Crops not stressed at this time.
Rain from hurricanes Cindy and Dennis have fields saturated; routine
care of livestock and poultry; catching up on equipment maintenance.
At least 8.8 rain since Saturday, lunchtime.
DISTRICT 5 - CENTRAL Rains have continued to slow wheat and hay harvests. Corn and grain sorghum conditions continue to improve as well as pasture conditions.
We are seeing a rise in disease problems due to the excess rainfall and higher humidity.
Wet weather continues!
Drought conditions continued all the way until Sunday afternoon. Sunday's rain was the first significant general rain in over a month here.
DISTRICT 6 - EAST CENTRAL Timely rains have all crops looking good. Very little insect pressure on cotton/peanuts. Only mild leafspot on peanuts. Boron, mepignat, layby fertilizer (cotton) and weed control going out along with peanut fungicides. Cattle thriving with plenty of grass. Late planted (behind wheat) soybeans off to a fast start.
Crops continue to progress very well. Pecan scab is abundant as well as leaf spot on peanut.
Scattered rain played havoc with hay cutting. Some areas wet, some dry.
DISTRICT 7 - SOUTHWEST Hurricane Dennis provided sufficient rain to bring soil moisture to 100% capacity through the county.
We received 0.82" of rainfall.
DISTRICT 8 - SOUTH CENTRAL Hot and wet. Concerned about hurricane. Applying fungicides on peanuts, applying herbicides on cotton and scouting for insects, and cutting hay. Applying pesticides to control suckers on tobacco and topping. Growers gearing up to pick tobacco.
Twenty percent of the tobacco crop has been lost to excessive moisture (drowned) and tomato spotted wilt virus.
Excess rain causing damage to cotton, tobacco and vegetables.
The hurricane has flooded many fields and made disease spraying operations in peanuts impossible.
DISTRICT 9 - SOUTHEAST No comments available.
Contact Information David S. Abbe, Director Georgia Agricultural Statistics Phone: 706-546-2236 E-mail: nass-ga@nass.usda.gov Website: http://www.nass.usda.gov/ga