- Collection:
- Georgia Government Publications
- Serial:
- Broiler hatchery news release / United States Department of Agriculture National Agricultural Statistics Service.
- Title:
- Broiler hatchery news release, 2023 June 7
- Creator:
- United States. Department of Agriculture. National Agricultural Statistics Service. Southern Region
- Contributor to Resource:
- Georgia. Department of Agriculture
Florida. Department of Agriculture and Consumer Services
Alabama. Department of Agriculture and Industries
South Carolina. Department of Agriculture - Publisher:
- Athens, Ga. : United States. Department of Agriculture. National Agricultural Statistics Service. Southern Region
- Date of Original:
- 2023-06-07
- Subject:
- Chickens--Hatcheries--Southern States--Statistics--Periodicals
Broilers (Chickens)--Southern States--Statistics--Periodicals
Poultry industry--Southern States--Statistics--Periodicals - Location:
- United States, Georgia, 32.75042, -83.50018
- Medium:
- official reports
tables (documents) - Type:
- Text
- Format:
- application/pdf
- Description:
- This news release contains Georgia agricultural statistics.
- External Identifiers:
- Call Number GA A400.C7 P1 H2 2023/6-7
- Metadata URL:
- https://dlg.galileo.usg.edu/id:dlg_ggpd_i-ga-ba400-pc7-bp1-bh2-b2023-s6-h7-belec-p-btext
- Digital Object URL:
- https://dlg.galileo.usg.edu/do:dlg_ggpd_i-ga-ba400-pc7-bp1-bh2-b2023-s6-h7-belec-p-btext
- Language:
- eng
- Holding Institution:
- University of Georgia. Map and Government Information Library
- Rights:
-

United States Department of Agriculture National Agricultural Statistics Service
Southern Region News Release Broiler Hatchery
Cooperating with the Alabama Department of Agriculture and Industries, Florida Department of Agriculture and Consumer Services, Georgia Department of Agriculture, and South Carolina Department of Agriculture
Southern Regional Field Office 355 East Hancock Avenue, Suite 100 Athens, GA 30601 (800) 253-4419 www.nass.usda.gov
This report contains the results from the Weekly Broiler Hatchery Survey. Thanks to all who responded.
June 7, 2023
Media Contact: Anthony Prillaman
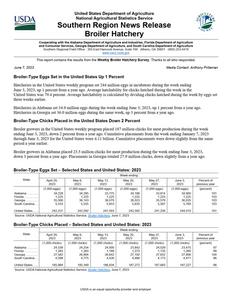
Broiler-Type Eggs Set in the United States Up 1 Percent
Hatcheries in the United States weekly program set 244 million eggs in incubators during the week ending June 3, 2023, up 1 percent from a year ago. Average hatchability for chicks hatched during the week in the United States was 79.4 percent. Average hatchability is calculated by dividing chicks hatched during the week by eggs set three weeks earlier.
Hatcheries in Alabama set 34.9 million eggs during the week ending June 3, 2023, up 1 percent from a year ago. Hatcheries in Georgia set 36.0 million eggs during the same week, up 3 percent from a year ago.
Broiler-Type Chicks Placed in the United States Down 2 Percent
Broiler growers in the United States weekly program placed 187 million chicks for meat production during the week ending June 3, 2023, down 2 percent from a year ago. Cumulative placements from the week ending January 7, 2023 through June 3, 2023 for the United States were 4.11 billion. Cumulative placements were down slightly from the same period a year earlier.
Broiler growers in Alabama placed 23.5 million chicks for meat production during the week ending June 3, 2023, down 3 percent from a year ago. Placements in Georgia totaled 27.9 million chicks, down slightly from a year ago.
Broiler-Type Eggs Set Selected States and United States: 2023
State
April 29, 2023
May 6, 2023
May 13, 2023
Week ending
May 20, 2023
(1,000 eggs)
(1,000 eggs)
(1,000 eggs)
(1,000 eggs)
Alabama ............. Florida ................ Georgia .............. South Carolina....
34,228 1,225
35,506 5,533
34,295 1,225
36,143 5,555
33,775 1,225
36,070 5,653
34,186 1,225
36,023 5,635
May 27, 2023
(1,000 eggs)
33,814 1,225
35,579 5,567
United States ......
242,231
242,592
241,593
242,592
Source: USDA National Agricultural Statistics Service, Broiler Hatchery, June 7, 2023
241,256
June 3, 2023
(1,000 eggs) 34,900 1,225 36,035 5,760
244,010
Percent of previous year
(percent) 101 103 103 103
101
Broiler-Type Chicks Placed Selected States and United States: 2023
State
April 29, 2023
May 6, 2023
May 13, 2023
Week ending
May 20, 2023
May 27, 2023
(1,000 chicks) (1,000 chicks) (1,000 chicks) (1,000 chicks) (1,000 chicks)
Alabama ............. Florida ................ Georgia .............. South Carolina....
24,539 1,283
27,582 4,598
24,254 1,283
26,894 4,775
24,000 1,189
26,642 4,426
23,842 1,273
27,192 4,466
24,029 1,155
27,652 4,173
United States ......
185,984
185,349
186,834
187,272
Source: USDA National Agricultural Statistics Service, Broiler Hatchery, June 7, 2023
187,683
June 3, 2023
(1,000 chicks) 23,475 1,260 27,906 4,471
187,227
Percent of previous year
(percent) 97 99
100 96
98
USDA is an equal opportunity provider and employer.
Broiler-Type Eggs Set Selected States and United States: 2023
State
April 29, 2023
May 6, 2023
Week ending
May 13, 2023
May 20, 2023
(1,000 eggs)
(1,000 eggs)
(1,000 eggs)
(1,000 eggs)
Alabama ................................. Arkansas ................................. Delaware ................................ Florida..................................... Georgia ...................................
Kentucky ................................. Louisiana ................................ Maryland ................................. Mississippi .............................. Missouri ..................................
34,228 25,139
5,440 1,225 35,506 6,787 3,531 8,081 16,301 10,129
34,295 25,001
5,430 1,225 36,143 6,727 3,548 8,092 16,815 10,100
33,775 24,878
5,433 1,225 36,070 6,610 3,500 8,089 15,978 10,100
34,186 24,865
5,445 1,225 36,023 6,222 3,502 8,090 16,559 10,100
North Carolina......................... Oklahoma ............................... Pennsylvania .......................... South Carolina ........................ Texas ...................................... Virginia.................................... California, Tennessee,
and West Virginia ..............
24,809 7,668 6,763 5,533
18,773 5,879
13,474
25,231 7,585 6,625 5,555
19,019 5,879
12,992
24,615 7,591 6,966 5,653
19,014 5,895
13,279
25,292 7,633 6,849 5,635
18,733 5,910
13,536
Other States............................
12,965
12,330
12,922
12,787
United States ..........................
242,231
242,592
241,593
Source: USDA National Agricultural Statistics Service, Broiler Hatchery, June 7, 2023
242,592
May 27, 2023
(1,000 eggs) 33,814 24,791 5,435 1,225 35,579 6,337 3,500 8,090 16,917 10,100
25,301 7,437 6,800 5,567
18,498 5,910
13,669
12,286
241,256
June 3, 2023
(1,000 eggs) 34,900 25,030 5,437 1,225 36,035 6,306 3,439 8,088 16,707 10,000
25,368 7,514 7,096 5,760
18,656 5,909
13,858
12,682
244,010
Broiler-Type Chicks Placed Selected States and United States: 2023
State
April 29, 2023
May 6, 2023
Week ending
May 13, 2023
May 20, 2023
(1,000 chicks)
(1,000 chicks)
(1,000 chicks)
(1,000 chicks)
Alabama ................................. Arkansas ................................. Delaware ................................ Florida..................................... Georgia ...................................
Kentucky ................................. Louisiana ................................ Maryland ................................. Mississippi .............................. Missouri ..................................
24,539 22,188
4,614 1,283 27,582 5,147 3,035 6,365 12,792 5,750
24,254 20,971
5,149 1,283 26,894 5,585 2,990 6,033 12,832 6,557
24,000 21,078
5,126 1,189 26,642 5,683 3,020 5,332 13,070 6,619
23,842 21,188
5,210 1,273 27,192 5,552 3,006 5,017 12,830 6,234
North Carolina......................... Oklahoma ............................... Pennsylvania .......................... South Carolina ........................ Texas ...................................... Virginia.................................... California, Tennessee,
and West Virginia ..............
18,645 4,618 4,547 4,598
14,382 5,040
11,830
19,071 4,716 4,318 4,775
14,461 4,947
11,487
19,259 4,752 4,376 4,426
14,418 5,676
12,700
19,481 5,216 4,429 4,466
14,850 5,735
12,185
Other States............................
9,029
9,026
9,468
9,566
United States ..........................
185,984
185,349
186,834
Source: USDA National Agricultural Statistics Service, Broiler Hatchery, June 7, 2023
187,272
May 27, 2023
(1,000 chicks) 24,029 22,313 4,595 1,155 27,652 5,992 2,971 5,379 13,412 6,324
19,531 4,091 4,295 4,173
14,865 5,837
12,083
8,986
187,683
June 3, 2023
(1,000 chicks) 23,475 21,036 4,895 1,260 27,906 5,866 2,749 5,702 12,768 6,980
19,123 4,589 4,568 4,471
15,105 5,701
11,476
9,557
187,227
USDA is an equal opportunity provider and employer.