- Collection:
- Georgia Government Publications
- Serial:
- Broiler hatchery news release / United States Department of Agriculture National Agricultural Statistics Service.
- Title:
- Broiler hatchery news release, 2023 April 5
- Creator:
- United States. Department of Agriculture. National Agricultural Statistics Service. Southern Region
- Contributor to Resource:
- Georgia. Department of Agriculture
Florida. Department of Agriculture and Consumer Services
Alabama. Department of Agriculture and Industries
South Carolina. Department of Agriculture - Publisher:
- Athens, Ga. : United States. Department of Agriculture. National Agricultural Statistics Service. Southern Region
- Date of Original:
- 2023-04-05
- Subject:
- Chickens--Hatcheries--Southern States--Statistics--Periodicals
Broilers (Chickens)--Southern States--Statistics--Periodicals
Poultry industry--Southern States--Statistics--Periodicals - Location:
- United States, Georgia, 32.75042, -83.50018
- Medium:
- official reports
tables (documents) - Type:
- Text
- Format:
- application/pdf
- Description:
- This news release contains Georgia agricultural statistics.
- External Identifiers:
- Call Number GA A400.C7 P1 H2 2023/4-5
- Metadata URL:
- https://dlg.galileo.usg.edu/id:dlg_ggpd_i-ga-ba400-pc7-bp1-bh2-b2023-s4-h5-belec-p-btext
- Digital Object URL:
- https://dlg.galileo.usg.edu/do:dlg_ggpd_i-ga-ba400-pc7-bp1-bh2-b2023-s4-h5-belec-p-btext
- Language:
- eng
- Holding Institution:
- University of Georgia. Map and Government Information Library
- Rights:
-

United States Department of Agriculture National Agricultural Statistics Service
Southern Region News Release Broiler Hatchery
Cooperating with the Alabama Department of Agriculture and Industries, Florida Department of Agriculture and Consumer Services, Georgia Department of Agriculture, and South Carolina Department of Agriculture
Southern Regional Field Office 355 East Hancock Avenue, Suite 100 Athens, GA 30601 (800) 253-4419 www.nass.usda.gov
This report contains the results from the Weekly Broiler Hatchery Survey. Thanks to all who responded.
April 5, 2023
Media Contact: Anthony Prillaman
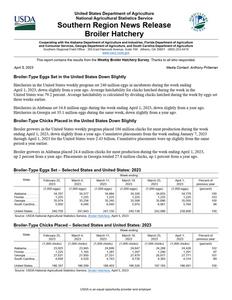
Broiler-Type Eggs Set in the United States Down Slightly
Hatcheries in the United States weekly program set 240 million eggs in incubators during the week ending April 1, 2023, down slightly from a year ago. Average hatchability for chicks hatched during the week in the United States was 79.2 percent. Average hatchability is calculated by dividing chicks hatched during the week by eggs set three weeks earlier.
Hatcheries in Alabama set 34.8 million eggs during the week ending April 1, 2023, down slightly from a year ago. Hatcheries in Georgia set 35.1 million eggs during the same week, down slightly from a year ago.
Broiler-Type Chicks Placed in the United States Down Slightly
Broiler growers in the United States weekly program placed 186 million chicks for meat production during the week ending April 1, 2023, down slightly from a year ago. Cumulative placements from the week ending January 7, 2023 through April 1, 2023 for the United States were 2.43 billion. Cumulative placements were up slightly from the same period a year earlier.
Broiler growers in Alabama placed 24.4 million chicks for meat production during the week ending April 1, 2023, up 2 percent from a year ago. Placements in Georgia totaled 27.8 million chicks, up 1 percent from a year ago.
Broiler-Type Eggs Set Selected States and United States: 2023
State
February 25, 2023
March 4, 2023
March 11, 2023
Week ending
March 18, 2023
(1,000 eggs)
(1,000 eggs)
(1,000 eggs)
(1,000 eggs)
Alabama ............. Florida ................ Georgia .............. South Carolina....
34,767 1,225
35,074 5,950
34,577 1,225
35,256 6,046
34,884 1,225
35,240 6,040
34,326 1,225
35,508 5,974
March 25, 2023
(1,000 eggs)
34,855 1,225
35,686 6,061
United States ......
240,759
241,843
241,150
240,138
Source: USDA National Agricultural Statistics Service, Broiler Hatchery, April 5, 2023
242,086
April 1, 2023
(1,000 eggs)
34,779 1,225
35,050 5,764
239,856
Percent of previous year
(percent)
100 103 100
98
100
Broiler-Type Chicks Placed Selected States and United States: 2023
State
February 25, 2023
March 4, 2023
March 11, 2023
Week ending
March 18, 2023
March 25, 2023
(1,000 chicks) (1,000 chicks) (1,000 chicks) (1,000 chicks) (1,000 chicks)
Alabama ............. Florida ................ Georgia .............. South Carolina....
23,925 1,225
27,631 4,658
23,945 1,165
27,950 4,520
24,699 1,287
27,551 4,743
24,647 1,207
27,479 4,730
24,288 1,290
26,977 4,383
United States ......
186,167
186,599
186,403
186,526
Source: USDA National Agricultural Statistics Service, Broiler Hatchery, April 5, 2023
187,183
April 1, 2023
(1,000 chicks) 24,426 1,291 27,771 4,314
186,491
Percent of previous year
(percent) 102 97 101 89
100
USDA is an equal opportunity provider and employer.
Broiler-Type Eggs Set Selected States and United States: 2023
State
February 25, 2023
March 4, 2023
Week ending
March 11, 2023
March 18, 2023
(1,000 eggs)
(1,000 eggs)
(1,000 eggs)
(1,000 eggs)
Alabama ................................. Arkansas ................................. Delaware ................................ Florida..................................... Georgia ...................................
Kentucky ................................. Louisiana ................................ Maryland ................................. Mississippi .............................. Missouri ..................................
34,767 24,818
5,372 1,225 35,074 6,626 3,411 8,094 16,924 9,776
34,577 24,461
5,369 1,225 35,256 6,580 3,289 8,095 17,000 9,714
34,884 24,268
5,491 1,225 35,240 6,052 3,290 8,095 16,680 9,660
34,326 24,650
5,369 1,225 35,508 6,397 3,290 8,091 17,108 9,489
North Carolina......................... Oklahoma ............................... Pennsylvania .......................... South Carolina ........................ Texas ...................................... Virginia.................................... California, Tennessee,
and West Virginia ..............
24,082 7,344 6,772 5,950
18,058 6,760
13,049
25,057 7,510 6,801 6,046
18,217 6,756
13,265
24,834 7,401 6,760 6,040
18,127 6,724
13,450
24,988 7,213 6,678 5,974
18,416 5,877
13,245
Other States............................
12,657
12,625
12,929
12,294
United States ..........................
240,759
241,843
241,150
Source: USDA National Agricultural Statistics Service, Broiler Hatchery, April 5, 2023
240,138
March 25, 2023
(1,000 eggs)
34,855 24,885
5,487 1,225 35,686 6,424 3,305 8,013 16,869 9,998
24,556 7,723 6,831 6,061
18,332 5,907
13,470
12,459
242,086
April 1, 2023
(1,000 eggs)
34,779 24,728
5,417 1,225 35,050 6,072 3,420 8,094 16,760 10,038
25,144 6,595 6,784 5,764
18,378 5,907
12,840
12,861
239,856
Broiler-Type Chicks Placed Selected States and United States: 2023
State
February 25, 2023
March 4, 2023
Week ending
March 11, 2023
March 18, 2023
(1,000 chicks)
(1,000 chicks)
(1,000 chicks)
(1,000 chicks)
Alabama ................................. Arkansas ................................. Delaware ................................ Florida..................................... Georgia ...................................
Kentucky ................................. Louisiana ................................ Maryland ................................. Mississippi .............................. Missouri ..................................
23,925 21,864
4,627 1,225 27,631 5,234 2,749 5,958 14,107 6,351
23,945 22,016
5,556 1,165 27,950 6,153 2,859 4,982 13,977 5,804
24,699 20,279
5,030 1,287 27,551 5,008 2,898 5,641 13,686 6,634
24,647 20,994
4,437 1,207 27,479 5,220 2,892 5,319 13,518 6,452
North Carolina......................... Oklahoma ............................... Pennsylvania .......................... South Carolina ........................ Texas ...................................... Virginia.................................... California, Tennessee,
and West Virginia ..............
18,652 3,604 4,491 4,658
14,374 5,990
11,462
19,063 3,996 4,081 4,520
14,512 6,092
10,691
19,006 4,700 4,444 4,743
14,265 5,902
11,569
18,658 4,381 4,558 4,730
14,364 6,617
11,562
Other States............................
9,265
9,237
9,061
9,491
United States ..........................
186,167
186,599
186,403
Source: USDA National Agricultural Statistics Service, Broiler Hatchery, April 5, 2023
186,526
March 25, 2023
(1,000 chicks) 24,288 21,047 4,823 1,290 26,977 5,383 2,862 5,718 13,580 6,258
19,879 4,274 4,541 4,383
14,437 5,889
12,044
9,510
187,183
April 1, 2023
(1,000 chicks) 24,426 20,127 5,007 1,291 27,771 4,737 2,816 5,208 13,322 6,020
19,327 5,074 4,568 4,314
14,447 5,704
12,643
9,689
186,491
USDA is an equal opportunity provider and employer.