- Collection:
- Georgia Government Publications
- Serial:
- Broiler hatchery news release / United States Department of Agriculture National Agricultural Statistics Service.
- Title:
- Broiler hatchery news release, 2023 March 1
- Creator:
- United States. Department of Agriculture. National Agricultural Statistics Service. Southern Region
- Contributor to Resource:
- Georgia. Department of Agriculture
Florida. Department of Agriculture and Consumer Services
Alabama. Department of Agriculture and Industries
South Carolina. Department of Agriculture - Publisher:
- Athens, Ga. : United States. Department of Agriculture. National Agricultural Statistics Service. Southern Region
- Date of Original:
- 2023-03-01
- Subject:
- Chickens--Hatcheries--Southern States--Statistics--Periodicals
Broilers (Chickens)--Southern States--Statistics--Periodicals
Poultry industry--Southern States--Statistics--Periodicals - Location:
- United States, Georgia, 32.75042, -83.50018
- Medium:
- official reports
tables (documents) - Type:
- Text
- Format:
- application/pdf
- Description:
- This news release contains Georgia agricultural statistics.
- External Identifiers:
- Call Number GA A400.C7 P1 H2 2023/3-1
- Metadata URL:
- https://dlg.galileo.usg.edu/id:dlg_ggpd_i-ga-ba400-pc7-bp1-bh2-b2023-s3-h1-belec-p-btext
- Digital Object URL:
- https://dlg.galileo.usg.edu/do:dlg_ggpd_i-ga-ba400-pc7-bp1-bh2-b2023-s3-h1-belec-p-btext
- Language:
- eng
- Holding Institution:
- University of Georgia. Map and Government Information Library
- Rights:
-

United States Department of Agriculture National Agricultural Statistics Service
Southern Region News Release Broiler Hatchery
Cooperating with the Alabama Department of Agriculture and Industries, Florida Department of Agriculture and Consumer Services, Georgia Department of Agriculture, and South Carolina Department of Agriculture
Southern Regional Field Office 355 East Hancock Avenue, Suite 100 Athens, GA 30601 (800) 253-4419 www.nass.usda.gov
This report contains the results from the Weekly Broiler Hatchery Survey. Thanks to all who responded.
March 1, 2023
Media Contact: Anthony Prillaman
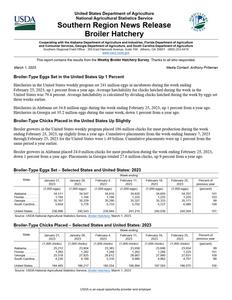
Broiler-Type Eggs Set in the United States Up 1 Percent
Hatcheries in the United States weekly program set 241 million eggs in incubators during the week ending February 25, 2023, up 1 percent from a year ago. Average hatchability for chicks hatched during the week in the United States was 79.4 percent. Average hatchability is calculated by dividing chicks hatched during the week by eggs set three weeks earlier.
Hatcheries in Alabama set 34.8 million eggs during the week ending February 25, 2023, up 1 percent from a year ago. Hatcheries in Georgia set 35.2 million eggs during the same week, down 1 percent from a year ago.
Broiler-Type Chicks Placed in the United States Up Slightly
Broiler growers in the United States weekly program placed 186 million chicks for meat production during the week ending February 25, 2023, up slightly from a year ago. Cumulative placements from the week ending January 7, 2023 through February 25, 2023 for the United States were 1.49 billion. Cumulative placements were up 1 percent from the same period a year earlier.
Broiler growers in Alabama placed 24.0 million chicks for meat production during the week ending February 25, 2023, down 1 percent from a year ago. Placements in Georgia totaled 27.6 million chicks, up 9 percent from a year ago.
Broiler-Type Eggs Set Selected States and United States: 2023
State
January 21, 2023
January 28, 2023
February 4, 2023
Week ending
February 11, 2023
(1,000 eggs)
(1,000 eggs)
(1,000 eggs)
(1,000 eggs)
Alabama ............. Florida ................ Georgia .............. South Carolina....
34,511 1,194
35,167 5,854
34,547 1,194
35,229 5,778
34,610 1,194
35,290 5,733
34,620 1,225
35,327 5,702
February 18, 2023
(1,000 eggs)
34,650 1,225
35,333 5,727
United States ......
238,996
240,543
239,944
241,210
Source: USDA National Agricultural Statistics Service, Broiler Hatchery, March 1, 2023
240,038
February 25, 2023
(1,000 eggs)
34,767 1,225
35,171 6,080
240,504
Percent of previous year
(percent)
101 103
99 109
101
Broiler-Type Chicks Placed Selected States and United States: 2023
State
January 21, 2023
January 28, 2023
February 4, 2023
Week ending
February 11, 2023
February 18, 2023
(1,000 chicks) (1,000 chicks) (1,000 chicks) (1,000 chicks) (1,000 chicks)
Alabama ............. Florida ................ Georgia .............. South Carolina....
25,212 1,283
25,518 4,230
23,604 1,282
27,825 4,189
23,383 1,248
26,612 5,316
23,958 1,262
28,667 4,960
23,696 1,266
27,990 4,962
United States ......
184,465
186,217
185,554
186,994
Source: USDA National Agricultural Statistics Service, Broiler Hatchery, March 1, 2023
187,593
February 25, 2023
(1,000 chicks) 23,954 1,225 27,631 4,701
186,075
Percent of previous year
(percent) 99
101 109
88
100
USDA is an equal opportunity provider and employer.
Broiler-Type Eggs Set Selected States and United States: 2023
State
January 21, 2023
January 28, 2023
Week ending
February 4, 2023
February 11, 2023
(1,000 eggs)
(1,000 eggs)
(1,000 eggs)
(1,000 eggs)
Alabama ................................. Arkansas ................................. Delaware ................................ Florida..................................... Georgia ...................................
Kentucky ................................. Louisiana ................................ Maryland ................................. Mississippi .............................. Missouri ..................................
34,511 23,954
5,088 1,194 35,167 6,659 3,243 8,066 16,468 9,779
34,547 24,648
5,183 1,194 35,229 6,719 3,244 8,056 16,591 9,916
34,610 24,576
5,299 1,194 35,290 6,291 3,290 8,058 16,710 9,954
34,620 24,821
5,488 1,225 35,327 6,268 3,411 8,081 16,665 9,954
North Carolina......................... Oklahoma ............................... Pennsylvania .......................... South Carolina ........................ Texas ...................................... Virginia.................................... California, Tennessee,
and West Virginia ..............
25,114 7,339 6,843 5,854
16,864 6,616
13,220
25,448 7,291 6,658 5,778
17,583 6,637
13,235
24,474 7,335 6,726 5,733
18,149 6,632
12,992
24,892 7,466 6,344 5,702
18,353 6,756
13,310
Other States............................
13,017
12,586
12,631
12,527
United States ..........................
238,996
240,543
239,944
Source: USDA National Agricultural Statistics Service, Broiler Hatchery, March 1, 2023
241,210
February 18, 2023
(1,000 eggs)
34,650 24,630
5,379 1,225 35,333 5,770 3,411 8,095 16,777 9,562
24,362 7,416 6,720 5,727
18,484 6,749
13,210
12,538
240,038
February 25, 2023
(1,000 eggs)
34,767 24,908
5,372 1,225 35,171 6,295 3,411 8,094 16,845 9,776
24,082 7,344 6,743 6,080
18,058 6,760
12,916
12,657
240,504
Broiler-Type Chicks Placed Selected States and United States: 2023
State
January 21, 2023
January 28, 2023
Week ending
February 4, 2023
February 11, 2023
(1,000 chicks)
(1,000 chicks)
(1,000 chicks)
(1,000 chicks)
Alabama ................................. Arkansas ................................. Delaware ................................ Florida..................................... Georgia ...................................
Kentucky ................................. Louisiana ................................ Maryland ................................. Mississippi .............................. Missouri ..................................
25,212 20,043
5,252 1,283 25,518 5,109 2,972 5,063 13,061 5,821
23,604 21,174
5,299 1,282 27,825 6,014 2,639 5,215 13,671 6,292
23,383 21,658
5,174 1,248 26,612 5,149 2,633 6,422 14,015 6,056
23,958 20,938
4,662 1,262 28,667 4,877 2,756 6,192 13,883 6,255
North Carolina......................... Oklahoma ............................... Pennsylvania .......................... South Carolina ........................ Texas ...................................... Virginia.................................... California, Tennessee,
and West Virginia ..............
19,429 5,619 4,393 4,230
14,075 6,421
11,602
19,469 3,854 4,433 4,189
14,318 5,996
11,680
19,016 4,033 4,439 5,316
13,569 4,601
12,477
19,226 4,087 4,505 4,960
13,448 5,333
12,030
Other States............................
9,362
9,263
9,753
9,955
United States ..........................
184,465
186,217
185,554
Source: USDA National Agricultural Statistics Service, Broiler Hatchery, March 1, 2023
186,994
February 18, 2023
(1,000 chicks) 23,696 21,716 5,075 1,266 27,990 5,371 2,784 6,394 14,136 6,756
19,204 3,527 4,494 4,962
13,969 5,569
10,991
9,693
187,593
February 25, 2023
(1,000 chicks) 23,954 22,208 4,627 1,225 27,631 4,872 2,749 6,622 14,084 6,351
18,699 3,231 4,493 4,701
14,374 5,226
11,450
9,578
186,075
USDA is an equal opportunity provider and employer.