- Collection:
- Georgia Government Publications
- Serial:
- Broiler hatchery news release / United States Department of Agriculture National Agricultural Statistics Service.
- Title:
- Broiler hatchery news release, 2023 January 25
- Creator:
- United States. Department of Agriculture. National Agricultural Statistics Service. Southern Region
- Contributor to Resource:
- Georgia. Department of Agriculture
Florida. Department of Agriculture and Consumer Services
Alabama. Department of Agriculture and Industries
South Carolina. Department of Agriculture - Publisher:
- Athens, Ga. : United States. Department of Agriculture. National Agricultural Statistics Service. Southern Region
- Date of Original:
- 2023-01-25
- Subject:
- Chickens--Hatcheries--Southern States--Statistics--Periodicals
Broilers (Chickens)--Southern States--Statistics--Periodicals
Poultry industry--Southern States--Statistics--Periodicals - Location:
- United States, Georgia, 32.75042, -83.50018
- Medium:
- official reports
tables (documents) - Type:
- Text
- Format:
- application/pdf
- Description:
- This news release contains Georgia agricultural statistics.
- External Identifiers:
- Call Number GA A400.C7 P1 H2 2023/1-25
- Metadata URL:
- https://dlg.galileo.usg.edu/id:dlg_ggpd_i-ga-ba400-pc7-bp1-bh2-b2023-s1-h25-belec-p-btext
- Digital Object URL:
- https://dlg.galileo.usg.edu/do:dlg_ggpd_i-ga-ba400-pc7-bp1-bh2-b2023-s1-h25-belec-p-btext
- Language:
- eng
- Holding Institution:
- University of Georgia. Map and Government Information Library
- Rights:
-

United States Department of Agriculture National Agricultural Statistics Service
Southern Region News Release Broiler Hatchery
Cooperating with the Alabama Department of Agriculture and Industries, Florida Department of Agriculture and Consumer Services, Georgia Department of Agriculture, and South Carolina Department of Agriculture
Southern Regional Field Office 355 East Hancock Avenue, Suite 100 Athens, GA 30601 (800) 253-4419 www.nass.usda.gov
This report contains the results from the Weekly Broiler Hatchery Survey. Thanks to all who responded.
January 25, 2023
Media Contact: Anthony Prillaman
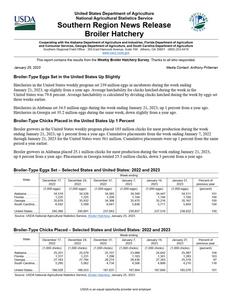
Broiler-Type Eggs Set in the United States Up Slightly
Hatcheries in the United States weekly program set 239 million eggs in incubators during the week ending January 21, 2023, up slightly from a year ago. Average hatchability for chicks hatched during the week in the United States was 79.8 percent. Average hatchability is calculated by dividing chicks hatched during the week by eggs set three weeks earlier.
Hatcheries in Alabama set 34.5 million eggs during the week ending January 21, 2023, up 1 percent from a year ago. Hatcheries in Georgia set 35.2 million eggs during the same week, down slightly from a year ago.
Broiler-Type Chicks Placed in the United States Up 1 Percent
Broiler growers in the United States weekly program placed 185 million chicks for meat production during the week ending January 21, 2023, up 1 percent from a year ago. Cumulative placements from the week ending January 7, 2022 through January 21, 2023 for the United States were 561 million. Cumulative placements were up 1 percent from the same period a year earlier.
Broiler growers in Alabama placed 25.1 million chicks for meat production during the week ending January 21, 2023, up 4 percent from a year ago. Placements in Georgia totaled 25.5 million chicks, down 3 percent from a year ago.
Broiler-Type Eggs Set Selected States and United States: 2022 and 2023
State
December 17, 2022
December 24, 2022
December 31, 2022
Week ending
January 7, 2023
January 14, 2023
(1,000 eggs)
(1,000 eggs)
(1,000 eggs)
(1,000 eggs)
(1,000 eggs)
Alabama ............. Florida ................ Georgia .............. South Carolina....
34,519 1,225
35,676 6,042
34,526 1,225
35,932 5,599
34,565 1,209
34,388 6,041
34,349 1,194
35,470 5,836
34,447 1,194
35,216 5,711
United States ......
240,366
240,691
237,943
239,857
Source: USDA National Agricultural Statistics Service, Broiler Hatchery, January 25, 2023
237,519
January 21, 2023
(1,000 eggs)
34,511 1,194
35,167 5,854
238,632
Percent of previous year
(percent)
101 100 100 104
100
Broiler-Type Chicks Placed Selected States and United States: 2022 and 2023
Week ending
State
December 17, 2022
December 24, 2022
December 31, 2022
January 7, 2023
January 14, 2023
January 21, 2023
(1,000 chicks) (1,000 chicks) (1,000 chicks) (1,000 chicks) (1,000 chicks) (1,000 chicks)
Alabama ............. Florida ................ Georgia .............. South Carolina....
25,251 1,317
27,183 5,295
25,079 1,231
27,784 5,062
25,107 1,298
28,274 4,734
23,988 1,183
28,436 4,506
24,642 1,301
27,343 4,899
25,087 1,283
25,518 4,210
United States ......
188,028
188,553
187,837
187,904
Source: USDA National Agricultural Statistics Service, Broiler Hatchery, January 25, 2023
187,690
185,076
Percent of previous year
(percent) 104 103 97 116
101
USDA is an equal opportunity provider and employer.
Broiler-Type Eggs Set Selected States and United States: 2022 and 2023
State
December 17, 2022
December 24, 2022
Week ending
December 31, 2022
January 7, 2023
(1,000 eggs)
(1,000 eggs)
(1,000 eggs)
(1,000 eggs)
Alabama ................................. Arkansas ................................. Delaware ................................ Florida..................................... Georgia ................................... Kentucky ................................. Louisiana ................................ Maryland ................................. Mississippi .............................. Missouri ..................................
34,519 24,383
5,166 1,225 35,676 6,400 2,938 8,001 16,341 9,812
34,526 24,432
5,206 1,225 35,932 6,652 3,426 8,066 16,054 9,761
34,565 24,177
4,913 1,209 34,388 6,638 3,426 8,066 15,872 9,825
34,349 24,090
5,302 1,194 35,470 6,283 3,123 8,067 16,271 9,871
North Carolina......................... Oklahoma ............................... Pennsylvania .......................... South Carolina ........................ Texas ...................................... Virginia.................................... California, Tennessee,
and West Virginia ..............
24,767 7,482 6,734 6,042
18,415 6,394
13,260
24,917 7,523 6,637 5,599
18,128 6,532
13,357
24,741 7,473 6,561 6,041
17,733 6,564
13,048
24,858 7,415 6,644 5,836
18,046 6,685
13,517
Other States............................
12,811
12,718
12,703
12,836
United States ..........................
240,366
240,691
237,943
Source: USDA National Agricultural Statistics Service, Broiler Hatchery, January 25, 2023
239,857
January 14, 2023
(1,000 eggs)
34,447 24,451
5,183 1,194 35,216 5,987 3,154 8,067 16,572 9,859
24,531 7,541 6,539 5,711
16,858 6,632
12,776
12,801
237,519
January 21, 2023
(1,000 eggs)
34,511 24,496
5,088 1,194 35,167 6,138 3,243 8,066 16,436 9,779
25,114 7,339 6,667 5,854
16,864 6,616
13,043
13,017
238,632
Broiler-Type Chicks Placed Selected States and United States: 2022 and 2023
State
December 17, 2022
December 24, 2022
Week ending
December 31, 2022
January 7, 2023
January 14, 2023
(1,000 chicks)
(1,000 chicks)
(1,000 chicks)
(1,000 chicks)
(1,000 chicks)
Alabama ................................. Arkansas ................................. Delaware ................................ Florida..................................... Georgia ................................... Kentucky ................................. Louisiana ................................ Maryland ................................. Mississippi .............................. Missouri ..................................
25,251 21,564
5,435 1,317 27,183 5,498 2,927 5,225 13,627 6,711
25,079 21,662
4,821 1,231 27,784 6,422 2,937 6,086 13,351 7,183
25,107 21,588
4,895 1,298 28,274 5,377 2,869 5,570 13,572 6,308
23,988 22,036
6,134 1,183 28,436 4,946 2,461 4,705 13,609 5,810
24,642 20,205
4,803 1,301 27,343 5,293 2,891 5,461 13,272 6,419
North Carolina......................... Oklahoma ............................... Pennsylvania .......................... South Carolina ........................ Texas ...................................... Virginia.................................... California, Tennessee,
and West Virginia ..............
18,664 3,921 4,781 5,295
14,159 4,544
12,210
18,498 3,054 4,724 5,062
14,684 5,700
10,804
17,982 4,202 4,500 4,734
14,601 5,746
11,618
19,276 4,296 4,545 4,506
14,598 5,779
12,023
19,319 5,334 4,541 4,899
14,444 5,952
12,021
Other States............................
9,716
9,471
9,596
9,573
9,550
United States ..........................
188,028
188,553
187,837
Source: USDA National Agricultural Statistics Service, Broiler Hatchery, January 25, 2023
187,904
187,690
January 21, 2023
(1,000 chicks) 25,087 19,248 5,252 1,283 25,518 5,146 2,972 4,815 13,073 6,425
19,629 6,041 4,381 4,210
14,075 6,617
11,951
9,353
185,076
USDA is an equal opportunity provider and employer.