United States Department of Agriculture National Agricultural Statistics Service
Southern Region News Release Broiler Hatchery
Cooperating with the Alabama Department of Agriculture and Industries, Florida Department of Agriculture and Consumer Services, Georgia Department of Agriculture, and South Carolina Department of Agriculture
Southern Regional Field Office 355 East Hancock Avenue, Suite 100 Athens, GA 30601 (706) 713-5400 www.nass.usda.gov
This report contains the results from the Weekly Broiler Hatchery Survey. Thanks to all who responded.
March 24, 2021
Media Contact: Anthony Prillaman
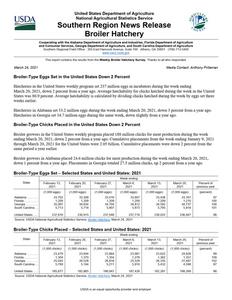
Broiler-Type Eggs Set in the United States Down 2 Percent
Hatcheries in the United States weekly program set 237 million eggs in incubators during the week ending March 20, 2021, down 2 percent from a year ago. Average hatchability for chicks hatched during the week in the United States was 80.9 percent. Average hatchability is calculated by dividing chicks hatched during the week by eggs set three weeks earlier.
Hatcheries in Alabama set 33.2 million eggs during the week ending March 20, 2021, down 3 percent from a year ago. Hatcheries in Georgia set 34.7 million eggs during the same week, down slightly from a year ago.
Broiler-Type Chicks Placed in the United States Down 2 Percent
Broiler growers in the United States weekly program placed 188 million chicks for meat production during the week ending March 20, 2021, down 2 percent from a year ago. Cumulative placements from the week ending January 9, 2021 through March 20, 2021 for the United States were 2.05 billion. Cumulative placements were down 2 percent from the same period a year earlier.
Broiler growers in Alabama placed 24.6 million chicks for meat production during the week ending March 20, 2021, down 1 percent from a year ago. Placements in Georgia totaled 27.5 million chicks, up 2 percent from a year ago.
Broiler-Type Eggs Set Selected States and United States: 2021
State
February 13, 2021
February 20, 2021
February 27, 2021
Week ending
March 6, 2021
(1,000 eggs)
(1,000 eggs)
(1,000 eggs)
(1,000 eggs)
Alabama ............. Florida ................ Georgia .............. South Carolina....
33,702 1,209
35,097 5,713
33,308 1,209
34,634 5,718
33,416 1,209
34,704 5,807
33,607 1,209
34,812 5,873
March 13, 2021
(1,000 eggs)
33,438 1,209
34,592 5,795
United States ......
237,616
230,915
237,048
237,716
Source: USDA National Agricultural Statistics Service, Broiler Hatchery, March 24, 2021
238,022
March 20, 2021
(1,000 eggs)
33,161 1,210
34,737 5,818
236,947
Percent of previous year
(percent)
97 100 100 101
98
Broiler-Type Chicks Placed Selected States and United States: 2021
State
February 13, 2021
February 20, 2021
February 27, 2021
Week ending
March 6, 2021
March 13, 2021
(1,000 chicks) (1,000 chicks) (1,000 chicks) (1,000 chicks) (1,000 chicks)
Alabama ............. Florida ................ Georgia .............. South Carolina....
23,479 1,304
25,045 5,789
23,604 1,370
26,528 5,184
23,864 1,354
26,818 5,211
23,981 1,278
25,529 5,910
23,622 1,362
26,335 5,432
United States ......
185,677
182,865
186,947
187,426
Source: USDA National Agricultural Statistics Service, Broiler Hatchery, March 24, 2021
182,287
March 20, 2021
(1,000 chicks)
24,628 1,351
27,487 4,598
188,269
Percent of previous year
(percent)
99 109 102
87
98
USDA is an equal opportunity provider and employer.
Broiler-Type Eggs Set Selected States and United States: 2021
State
February 13, 2021
February 20, 2021
Week ending
February 27, 2021
March 6, 2021
(1,000 eggs)
(1,000 eggs)
(1,000 eggs)
(1,000 eggs)
Alabama ............................................. Arkansas ............................................. Delaware ............................................ Florida ................................................. Georgia ............................................... Kentucky ............................................. Louisiana ............................................ Maryland ............................................. Mississippi .......................................... Missouri ..............................................
33,702 24,195
4,948 1,209 35,097 8,037 3,562 7,911 17,038 9,197
33,308 23,913
4,948 1,209 34,634 7,877 2,284 7,912 16,946 9,116
33,416 24,194
4,762 1,209 34,704 8,063 3,485 7,942 16,936 9,014
33,607 24,084
5,042 1,209 34,812 8,050 3,562 7,942 17,160 9,316
North Carolina ..................................... Oklahoma ........................................... Pennsylvania ...................................... South Carolina .................................... Texas .................................................. Virginia ................................................ California, Tennessee,
and West Virginia ..............................
25,056 7,279 6,312 5,713
17,356 6,458
12,853
24,992 6,595 6,228 5,718
14,171 6,303
13,131
25,005 7,582 6,371 5,807
16,927 6,423
13,039
25,089 7,156 6,322 5,873
17,176 6,500
12,493
Other States ........................................
11,693
11,630
12,169
12,323
United States ...................................... Percent of previous year .....................
237,616 99
230,915 97
237,048 99
Source: USDA National Agricultural Statistics Service, Broiler Hatchery, March 24, 2021
237,716 99
March 13, 2021
(1,000 eggs)
33,438 24,092
4,948 1,209 34,592 7,852 3,441 7,944 16,877 9,450
25,103 7,168 6,364 5,795
17,545 6,530
13,312
12,362
238,022 100
March 20, 2021
(1,000 eggs)
33,161 24,265
4,947 1,210 34,737 7,962 3,265 7,914 16,920 9,232
25,037 6,693 6,353 5,818
17,639 6,470
13,045
12,279
236,947 98
Broiler-Type Chicks Placed Selected States and United States: 2021
State
February 13, 2021
February 20, 2021
Week ending
February 27, 2021
March 6, 2021
(1,000 chicks) (1,000 chicks) (1,000 chicks) (1,000 chicks)
Alabama ............................................. Arkansas ............................................. Delaware ............................................ Florida ................................................. Georgia ............................................... Kentucky ............................................. Louisiana ............................................ Maryland ............................................. Mississippi .......................................... Missouri ..............................................
23,479 21,691
5,320 1,304 25,045 6,628 3,019 5,731 13,870 5,125
23,604 21,877
4,050 1,370 26,528 5,596 1,632 5,374 13,777 5,410
23,864 21,927
3,958 1,354 26,818 5,365 2,358 6,241 14,430 5,665
23,981 22,948
5,578 1,278 25,529 5,963 3,041 4,672 14,402 6,209
March 13, 2021
(1,000 chicks)
23,622 20,973
4,848 1,362 26,335 6,806 1,883 5,791 14,273 6,461
March 20, 2021
(1,000 chicks)
24,628 20,503
5,028 1,351 27,487 5,690 2,800 5,648 13,980 5,942
North Carolina ..................................... Oklahoma ........................................... Pennsylvania ...................................... South Carolina .................................... Texas .................................................. Virginia ................................................ California, Tennessee,
and West Virginia ..............................
19,810 4,856 5,058 5,789
13,990 4,633
11,439
20,048 4,382 4,388 5,184
14,124 6,028
11,079
20,015 4,341 4,976 5,211
14,904 5,117
12,184
20,689 2,423 4,714 5,910
13,993 5,289
11,452
20,279 3,354 4,553 5,432
11,552 5,199
10,561
20,892 4,585 4,701 4,598
14,749 5,100
11,123
Other States ........................................
8,890
8,414
8,219
9,355
9,003
9,464
United States ...................................... Percent of previous year .....................
185,677 98
182,865 95
186,947 98
Source: USDA National Agricultural Statistics Service, Broiler Hatchery, March 24, 2021
187,426 98
182,287 97
188,269 98
