- Collection:
- Georgia Government Publications
- Serial:
- Broiler hatchery news release / United States Department of Agriculture National Agricultural Statistics Service.
- Title:
- Broiler hatchery news release, 2021 February 3
- Creator:
- United States. Department of Agriculture. National Agricultural Statistics Service. Southern Region
- Contributor to Resource:
- Georgia. Department of Agriculture
Florida. Department of Agriculture and Consumer Services
Alabama. Department of Agriculture and Industries
South Carolina. Department of Agriculture - Publisher:
- Athens, Ga. : United States. Department of Agriculture. National Agricultural Statistics Service. Southern Region
- Date of Original:
- 2021-02-03
- Subject:
- Chickens--Hatcheries--Southern States--Statistics--Periodicals
Broilers (Chickens)--Southern States--Statistics--Periodicals
Poultry industry--Southern States--Statistics--Periodicals - Location:
- United States, Georgia, 32.75042, -83.50018
- Medium:
- official reports
tables (documents) - Type:
- Text
- Format:
- application/pdf
- Description:
- Began with: August 28, 2013.
Effective March 12, 2014, name of issuing body appears as Southern Regional Field Office.
August 28, 2013; title from caption (Georgia Government Publications database, viewed January 19, 2018).
January 17, 2018 (received via e-mail on January 18, 2018 from Georgia Department of Agriculture); (Georgia Government Publications database, viewed November 22, 2017). - External Identifiers:
- Call Number GA A400.C7 P1 H2 2021/2-3
- Metadata URL:
- https://dlg.galileo.usg.edu/id:dlg_ggpd_i-ga-ba400-pc7-bp1-bh2-b2021-s2-h3-belec-p-btext
- Digital Object URL:
- https://dlg.galileo.usg.edu/do:dlg_ggpd_i-ga-ba400-pc7-bp1-bh2-b2021-s2-h3-belec-p-btext
- Language:
- eng
- Holding Institution:
- University of Georgia. Map and Government Information Library
- Rights:
-

United States Department of Agriculture National Agricultural Statistics Service
Southern Region News Release Broiler Hatchery
Cooperating with the Alabama Department of Agriculture and Industries, Florida Department of Agriculture and Consumer Services, Georgia Department of Agriculture, and South Carolina Department of Agriculture
Southern Regional Field Office 355 East Hancock Avenue, Suite 100 Athens, GA 30601 (706) 713-5400 www.nass.usda.gov
This report contains the results from the Weekly Broiler Hatchery Survey. Thanks to all who responded.
February 3, 2021
Media Contact: Anthony Prillaman
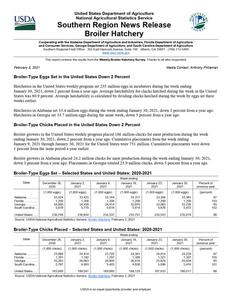
Broiler-Type Eggs Set in the United States Down 2 Percent
Hatcheries in the United States weekly program set 235 million eggs in incubators during the week ending January 30, 2021, down 2 percent from a year ago. Average hatchability for chicks hatched during the week in the United States was 80.9 percent. Average hatchability is calculated by dividing chicks hatched during the week by eggs set three weeks earlier.
Hatcheries in Alabama set 33.4 million eggs during the week ending January 30, 2021, down 3 percent from a year ago. Hatcheries in Georgia set 33.7 million eggs during the same week, down 5 percent from a year ago.
Broiler-Type Chicks Placed in the United States Down 2 Percent
Broiler growers in the United States weekly program placed 186 million chicks for meat production during the week ending January 30, 2021, down 2 percent from a year ago. Cumulative placements from the week ending January 9, 2021 through January 30, 2021 for the United States were 751 million. Cumulative placements were down 1 percent from the same period a year earlier.
Broiler growers in Alabama placed 24.2 million chicks for meat production during the week ending January 30, 2021, down 3 percent from a year ago. Placements in Georgia totaled 25.9 million chicks, down 5 percent from a year ago.
Broiler-Type Eggs Set Selected States and United States: 2020-2021
State
December 26, 2020
January 2, 2021
January 9, 2021
Week ending
January 16, 2021
January 23, 2021
(1,000 eggs)
(1,000 eggs)
(1,000 eggs)
(1,000 eggs)
(1,000 eggs)
Alabama .............. Florida ................. Georgia ............... South Carolina ....
33,424 1,209
34,608 5,879
33,425 1,209
34,438 5,770
33,144 1,209
34,414 5,618
33,317 1,209
32,870 5,914
33,306 1,209
33,083 5,878
United States ......
236,749
236,850
234,337
235,751
Source: USDA National Agricultural Statistics Service, Broiler Hatchery, February 3, 2021
234,543
January 30, 2021
(1,000 eggs)
33,381 1,209
33,726 5,872
235,074
Percent of previous year
(percent)
97 103
95 102
98
Broiler-Type Chicks Placed Selected States and United States: 2020-2021
State
December 26, 2020
January 2, 2021
January 9, 2021
Week ending
January 16, 2021
January 23, 2021
(1,000 chicks) (1,000 chicks) (1,000 chicks) (1,000 chicks) (1,000 chicks)
Alabama .............. Florida ................. Georgia ............... South Carolina ....
23,088 1,291
25,293 5,787
24,414 1,182
26,993 4,993
23,720 1,297
26,809 5,403
24,341 1,309
26,418 4,938
24,914 1,321
25,829 5,096
United States ......
183,069
188,541
189,060
188,129
Source: USDA National Agricultural Statistics Service, Broiler Hatchery, February 3, 2021
187,935
January 30, 2021
(1,000 chicks)
24,239 1,367
25,934 5,474
186,011
Percent of previous year
(percent)
97 105
95 101
98
USDA is an equal opportunity provider and employer.
Broiler-Type Eggs Set Selected States and United States: 2020-2021
State
December 26, 2020
January 2, 2021
Week ending
January 9, 2021
January 16, 2021
(1,000 eggs)
(1,000 eggs)
(1,000 eggs)
(1,000 eggs)
Alabama ................................................ Arkansas ............................................... Delaware ............................................... Florida .................................................... Georgia .................................................. Kentucky ................................................ Louisiana ............................................... Maryland ................................................ Mississippi ............................................. Missouri .................................................
33,424 24,253
4,669 1,209 34,608 7,889 3,532 7,636 17,929 9,198
33,425 24,178
4,669 1,209 34,438 7,693 3,532 7,639 17,885 9,227
33,144 24,319
4,669 1,209 34,414 7,534 2,987 7,637 17,222 9,165
33,317 24,446
4,669 1,209 32,870 8,025 3,516 7,640 17,660 9,149
North Carolina ....................................... Oklahoma .............................................. Pennsylvania ......................................... South Carolina ...................................... Texas ..................................................... Virginia .................................................. California, Tennessee,
and West Virginia ...............................
23,668 6,972 6,293 5,879
18,052 6,415
13,173
24,130 7,068 6,293 5,770
18,280 6,509
13,085
23,969 7,058 6,318 5,618
17,728 6,432
13,068
24,330 7,183 6,293 5,914
17,761 6,505
13,039
Other States ..........................................
11,950
11,820
11,846
12,225
United States ........................................ Percent of previous year ......................
236,749 99
236,850 100
234,337 99
Source: USDA National Agricultural Statistics Service, Broiler Hatchery, February 3, 2021
235,751 98
January 23, 2021
(1,000 eggs)
33,306 24,405
4,948 1,209 33,083 8,003 3,562 7,635 17,127 9,244
24,151 7,072 6,336 5,878
17,505 6,462
13,227
11,390
234,543 99
January 30, 2021
(1,000 eggs)
33,381 24,556
4,948 1,209 33,726 7,607 3,516 7,380 17,804 9,244
23,920 6,944 6,315 5,872
18,115 6,313
13,180
11,044
235,074 98
Broiler-Type Chicks Placed Selected States and United States: 2020-2021
State
December 26, 2020
January 2, 2021
Week ending
January 9, 2021
January 16, 2021
(1,000 chicks) (1,000 chicks) (1,000 chicks) (1,000 chicks)
Alabama ................................................ Arkansas ............................................... Delaware ............................................... Florida .................................................... Georgia .................................................. Kentucky ................................................ Louisiana ............................................... Maryland ................................................ Mississippi ............................................. Missouri .................................................
23,088 22,112
4,047 1,291 25,293 5,479 2,677 6,493 14,762 5,516
24,414 20,607
5,160 1,182 26,993 6,369 2,961 4,704 15,203 5,921
23,720 20,689
4,616 1,297 26,809 5,710 3,125 5,239 15,149 6,542
24,341 22,064
4,952 1,309 26,418 6,345 3,002 4,489 15,129 6,763
January 23, 2021
(1,000 chicks)
24,914 21,812
4,533 1,321 25,829 5,740 3,015 4,865 15,013 6,480
January 30, 2021
(1,000 chicks)
24,239 22,251
4,306 1,367 25,934 6,586 2,575 5,542 14,464 5,925
North Carolina ....................................... Oklahoma .............................................. Pennsylvania ......................................... South Carolina ...................................... Texas ..................................................... Virginia .................................................. California, Tennessee,
and West Virginia ...............................
19,288 4,096 4,760 5,787
14,083 4,874
10,363
19,735 4,880 4,771 4,993
14,687 5,757
10,620
19,639 4,273 4,785 5,403
14,896 5,732
11,815
19,207 3,206 4,760 4,938
14,680 6,021
11,522
19,594 3,744 4,889 5,096
14,572 6,408
11,323
19,280 3,584 4,771 5,474
14,322 5,731
10,713
Other States ..........................................
9,060
9,584
9,621
8,983
8,787
8,947
United States ........................................
183,069
188,541
189,060
Percent of previous year ......................
97
99
100
Source: USDA National Agricultural Statistics Service, Broiler Hatchery, February 3, 2021
188,129 99
187,935 98
186,011 98