- Collection:
- Georgia Government Publications
- Serial:
- Broiler hatchery news release / United States Department of Agriculture National Agricultural Statistics Service.
- Title:
- Broiler hatchery news release, 2020 September 2
- Creator:
- United States. Department of Agriculture. National Agricultural Statistics Service. Southern Region
- Contributor to Resource:
- Georgia. Department of Agriculture
Florida. Department of Agriculture and Consumer Services
Alabama. Department of Agriculture and Industries
South Carolina. Department of Agriculture - Publisher:
- Athens, Ga. : United States. Department of Agriculture. National Agricultural Statistics Service. Southern Region
- Date of Original:
- 2020-09-02
- Subject:
- Chickens--Hatcheries--Southern States--Statistics--Periodicals
Broilers (Chickens)--Southern States--Statistics--Periodicals
Poultry industry--Southern States--Statistics--Periodicals - Location:
- United States, Georgia, 32.75042, -83.50018
- Medium:
- official reports
tables (documents) - Type:
- Text
- Format:
- application/pdf
- Description:
- Began with: August 28, 2013.
Effective March 12, 2014, name of issuing body appears as Southern Regional Field Office.
August 28, 2013; title from caption (Georgia Government Publications database, viewed January 19, 2018).
January 17, 2018 (received via e-mail on January 18, 2018 from Georgia Department of Agriculture); (Georgia Government Publications database, viewed November 22, 2017). - External Identifiers:
- Call Number GA A400.C7 P1 H2 2020/9-2
- Metadata URL:
- https://dlg.galileo.usg.edu/id:dlg_ggpd_i-ga-ba400-pc7-bp1-bh2-b2020-s9-h2-belec-p-btext
- Digital Object URL:
- https://dlg.galileo.usg.edu/do:dlg_ggpd_i-ga-ba400-pc7-bp1-bh2-b2020-s9-h2-belec-p-btext
- Language:
- eng
- Holding Institution:
- University of Georgia. Map and Government Information Library
- Rights:
-

United States Department of Agriculture National Agricultural Statistics Service
Southern Region News Release Broiler Hatchery
Cooperating with the Alabama Department of Agriculture and Industries, Florida Department of Agriculture and Consumer Services, Georgia Department of Agriculture, and South Carolina Department of Agriculture
Southern Regional Field Office 355 East Hancock Avenue, Suite 100 Athens, GA 30601 (706) 713-5400 www.nass.usda.gov
This report contains the results from the Weekly Broiler Hatchery Survey. Thanks to all who responded.
September 2, 2020
Media Contact: Anthony Prillaman
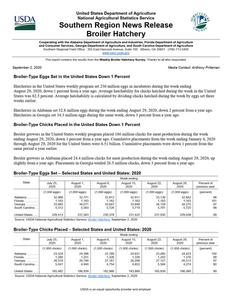
Broiler-Type Eggs Set in the United States Down 1 Percent
Hatcheries in the United States weekly program set 230 million eggs in incubators during the week ending August 29, 2020, down 1 percent from a year ago. Average hatchability for chicks hatched during the week in the United States was 82.5 percent. Average hatchability is calculated by dividing chicks hatched during the week by eggs set three weeks earlier.
Hatcheries in Alabama set 32.8 million eggs during the week ending August 29, 2020, down 2 percent from a year ago. Hatcheries in Georgia set 34.3 million eggs during the same week, down 3 percent from a year ago.
Broiler-Type Chicks Placed in the United States Down 1 Percent
Broiler growers in the United States weekly program placed 186 million chicks for meat production during the week ending August 29, 2020, down 1 percent from a year ago. Cumulative placements from the week ending January 4, 2020 through August 29, 2020 for the United States were 6.51 billion. Cumulative placements were down 1 percent from the same period a year earlier.
Broiler growers in Alabama placed 24.4 million chicks for meat production during the week ending August 29, 2020, up slightly from a year ago. Placements in Georgia totaled 26.5 million chicks, down 3 percent from a year ago.
Broiler-Type Eggs Set Selected States and United States: 2020
State
July 25, 2020
August 1, 2020
August 8, 2020
Week ending
August 15, 2020
(1,000 eggs)
(1,000 eggs)
(1,000 eggs)
(1,000 eggs)
Alabama ............. Florida ................ Georgia .............. South Carolina....
32,966 1,163
33,983 5,312
32,771 1,163
34,071 5,583
32,813 1,162
33,647 5,726
32,911 1,163
33,848 5,719
August 22, 2020
(1,000 eggs)
33,136 1,163
34,159 5,791
United States ......
228,413
231,563
230,378
231,422
Source: USDA National Agricultural Statistics Service, Broiler Hatchery, September 2, 2020
231,930
August 29, 2020
(1,000 eggs)
32,842 1,163
34,275 5,725
229,938
Percent of previous year
(percent)
98 101
97 98
99
Broiler-Type Chicks Placed Selected States and United States: 2020
State
July 25, 2020
August 1, 2020
August 8, 2020
Week ending
August 15, 2020
August 22, 2020
(1,000 chicks) (1,000 chicks) (1,000 chicks) (1,000 chicks) (1,000 chicks)
Alabama ............. Florida ................ Georgia .............. South Carolina....
23,524 1,260
26,519 5,041
24,396 1,251
26,748 4,940
22,789 1,326
27,167 4,754
24,631 1,339
26,208 4,653
23,485 1,203
27,127 5,584
United States ......
185,482
186,939
182,966
183,889
Source: USDA National Agricultural Statistics Service, Broiler Hatchery, September 2, 2020
185,839
August 29, 2020
(1,000 chicks)
24,423 1,316
26,513 4,274
186,080
Percent of previous year
(percent)
100 99 97 80
99
USDA is an equal opportunity provider and employer.
Broiler-Type Eggs Set Selected States and United States: 2020
State
July 25, 2020
August 1, 2020
Week ending
August 8, 2020
August 15, 2020
(1,000 eggs)
(1,000 eggs)
(1,000 eggs)
(1,000 eggs)
Alabama ............................................. Arkansas ............................................. Delaware ............................................ Florida ................................................. Georgia ............................................... Kentucky ............................................. Louisiana ............................................ Maryland ............................................. Mississippi .......................................... Missouri ..............................................
32,966 22,755
4,547 1,163 33,983 7,767 3,364 8,018 16,932 8,886
32,771 23,431
4,548 1,163 34,071 7,657 3,319 8,092 16,764 8,937
32,813 23,326
4,825 1,162 33,647 6,726 3,319 8,140 16,863 8,857
32,911 23,489
4,825 1,163 33,848 7,754 3,185 8,135 17,218 8,853
North Carolina ..................................... Oklahoma ........................................... Pennsylvania ...................................... South Carolina .................................... Texas .................................................. Virginia ................................................ California, Tennessee,
and West Virginia ..............................
24,104 6,863 6,335 5,312
16,893 5,809
11,995
24,549 7,145 6,493 5,583
17,171 6,206
12,850
24,614 6,966 6,515 5,726
17,354 6,082
12,571
24,667 7,084 6,401 5,719
17,315 6,216
11,910
Other States ........................................
10,721
10,813
10,872
10,729
United States ...................................... Percent of previous year .....................
228,413 98
231,563 99
230,378 99
Source: USDA National Agricultural Statistics Service, Broiler Hatchery, September 2, 2020
231,422 99
August 22, 2020
(1,000 eggs)
33,136 23,251
4,826 1,163 34,159 7,725 3,272 8,122 16,752 8,857
24,058 6,928 6,411 5,791
17,502 6,218
12,815
10,944
231,930 100
August 29, 2020
(1,000 eggs)
32,842 23,075
4,826 1,163 34,275 6,838 3,319 8,131 16,473 8,888
23,996 7,279 6,387 5,725
16,794 6,161
12,605
11,161
229,938 99
Broiler-Type Chicks Placed Selected States and United States: 2020
State
July 25, 2020
August 1, 2020
Week ending
August 8, 2020
August 15, 2020
(1,000 chicks) (1,000 chicks) (1,000 chicks) (1,000 chicks)
Alabama ............................................. Arkansas ............................................. Delaware ............................................ Florida ................................................. Georgia ............................................... Kentucky ............................................. Louisiana ............................................ Maryland ............................................. Mississippi .......................................... Missouri ..............................................
23,524 20,956
4,901 1,260 26,519 5,720 2,913 5,292 15,029 5,640
24,396 22,846
4,981 1,251 26,748 6,863 2,922 5,357 14,614 5,321
22,789 20,569
4,999 1,326 27,167 6,696 2,717 4,959 13,538 7,442
24,631 21,635
4,746 1,339 26,208 6,319 2,791 5,293 14,283 6,673
August 22, 2020
(1,000 chicks)
23,485 21,267
4,395 1,203 27,127 5,799 2,921 5,470 14,245 6,018
August 29, 2020
(1,000 chicks)
24,423 21,441
4,350 1,316 26,513 5,375 2,744 6,018 14,369 6,432
North Carolina ..................................... Oklahoma ........................................... Pennsylvania ...................................... South Carolina .................................... Texas .................................................. Virginia ................................................ California, Tennessee,
and West Virginia ..............................
19,728 3,909 4,829 5,041
14,172 5,833
11,172
19,287 3,180 4,924 4,940
13,823 5,816
10,672
19,584 3,149 4,897 4,754
13,819 6,002
9,097
19,410 2,850 4,810 4,653
13,893 5,283
10,686
19,851 4,440 4,941 5,584
14,268 5,589
10,641
20,290 3,754 4,962 4,274
14,559 6,082
10,370
Other States ........................................
9,044
8,998
9,462
8,386
8,595
8,808
United States ...................................... Percent of previous year .....................
185,482 98
186,939 99
182,966 97
Source: USDA National Agricultural Statistics Service, Broiler Hatchery, September 2, 2020
183,889 97
185,839 98
186,080 99