- Collection:
- Georgia Government Publications
- Serial:
- Broiler hatchery news release / United States Department of Agriculture National Agricultural Statistics Service.
- Title:
- Broiler hatchery news release, 2020 August 12
- Creator:
- United States. Department of Agriculture. National Agricultural Statistics Service. Southern Region
- Contributor to Resource:
- Georgia. Department of Agriculture
Florida. Department of Agriculture and Consumer Services
Alabama. Department of Agriculture and Industries
South Carolina. Department of Agriculture - Publisher:
- Athens, Ga. : United States. Department of Agriculture. National Agricultural Statistics Service. Southern Region
- Date of Original:
- 2020-08-12
- Subject:
- Chickens--Hatcheries--Southern States--Statistics--Periodicals
Broilers (Chickens)--Southern States--Statistics--Periodicals
Poultry industry--Southern States--Statistics--Periodicals - Location:
- United States, Georgia, 32.75042, -83.50018
- Medium:
- official reports
tables (documents) - Type:
- Text
- Format:
- application/pdf
- Description:
- Began with: August 28, 2013.
Effective March 12, 2014, name of issuing body appears as Southern Regional Field Office.
August 28, 2013; title from caption (Georgia Government Publications database, viewed January 19, 2018).
January 17, 2018 (received via e-mail on January 18, 2018 from Georgia Department of Agriculture); (Georgia Government Publications database, viewed November 22, 2017). - External Identifiers:
- Call Number GA A400.C7 P1 H2 2020/8-12
- Metadata URL:
- https://dlg.galileo.usg.edu/id:dlg_ggpd_i-ga-ba400-pc7-bp1-bh2-b2020-s8-h12-belec-p-btext
- Digital Object URL:
- https://dlg.galileo.usg.edu/do:dlg_ggpd_i-ga-ba400-pc7-bp1-bh2-b2020-s8-h12-belec-p-btext
- Language:
- eng
- Holding Institution:
- University of Georgia. Map and Government Information Library
- Rights:
-

United States Department of Agriculture National Agricultural Statistics Service
Southern Region News Release Broiler Hatchery
Cooperating with the Alabama Department of Agriculture and Industries, Florida Department of Agriculture and Consumer Services, Georgia Department of Agriculture, and South Carolina Department of Agriculture
Southern Regional Field Office 355 East Hancock Avenue, Suite 100 Athens, GA 30601 (706) 713-5400 www.nass.usda.gov
This report contains the results from the Weekly Broiler Hatchery Survey. Thanks to all who responded.
August 12, 2020
Media Contact: Anthony Prillaman
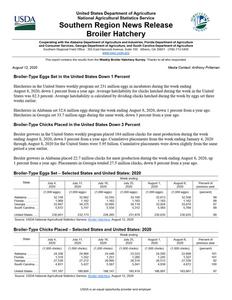
Broiler-Type Eggs Set in the United States Down 1 Percent
Hatcheries in the United States weekly program set 231 million eggs in incubators during the week ending August 8, 2020, down 1 percent from a year ago. Average hatchability for chicks hatched during the week in the United States was 82.3 percent. Average hatchability is calculated by dividing chicks hatched during the week by eggs set three weeks earlier.
Hatcheries in Alabama set 32.6 million eggs during the week ending August 8, 2020, down 1 percent from a year ago. Hatcheries in Georgia set 33.7 million eggs during the same week, down 3 percent from a year ago.
Broiler-Type Chicks Placed in the United States Down 3 Percent
Broiler growers in the United States weekly program placed 184 million chicks for meat production during the week ending August 8, 2020, down 3 percent from a year ago. Cumulative placements from the week ending January 4, 2020 through August 8, 2020 for the United States were 5.95 billion. Cumulative placements were down slightly from the same period a year earlier.
Broiler growers in Alabama placed 22.7 million chicks for meat production during the week ending August 8, 2020, up 1 percent from a year ago. Placements in Georgia totaled 27.5 million chicks, down 8 percent from a year ago.
Broiler-Type Eggs Set Selected States and United States: 2020
State
July 4, 2020
July 11, 2020
July 18, 2020
Week ending
July 25, 2020
(1,000 eggs)
(1,000 eggs)
(1,000 eggs)
(1,000 eggs)
Alabama ............. Florida ................ Georgia .............. South Carolina....
32,158 1,069
33,947 5,672
32,662 1,162
34,375 5,747
32,555 1,163
33,895 5,550
33,109 1,163
34,119 5,312
August 1, 2020
(1,000 eggs)
32,613 1,163
33,924 5,583
United States ......
230,601
232,173
228,265
231,879
Source: USDA National Agricultural Statistics Service, Broiler Hatchery, August 12, 2020
230,635
August 8, 2020
(1,000 eggs)
32,556 1,162
33,674 5,769
230,625
Percent of previous year
(percent)
99 99 97 99
99
Broiler-Type Chicks Placed Selected States and United States: 2020
State
July 4, 2020
July 11, 2020
July 18, 2020
Week ending
July 25, 2020
August 1, 2020
(1,000 chicks) (1,000 chicks) (1,000 chicks) (1,000 chicks) (1,000 chicks)
Alabama ............. Florida ................ Georgia .............. South Carolina....
24,336 1,319
27,539 4,831
24,984 1,352
27,212 5,427
24,446 1,251
26,995 5,567
23,523 1,260
26,519 5,041
24,595 1,245
26,513 4,939
United States ......
191,187
189,600
188,147
185,419
Source: USDA National Agricultural Statistics Service, Broiler Hatchery, August 12, 2020
186,897
August 8, 2020
(1,000 chicks)
22,699 1,327
27,539 4,672
183,661
Percent of previous year
(percent)
101 101
92 100
97
USDA is an equal opportunity provider and employer.
Broiler-Type Eggs Set Selected States and United States: 2020
State
July 4, 2020
July 11, 2020
Week ending
July 18, 2020
July 25, 2020
(1,000 eggs)
(1,000 eggs)
(1,000 eggs)
(1,000 eggs)
Alabama ............................................. Arkansas ............................................. Delaware ............................................ Florida ................................................. Georgia ............................................... Kentucky ............................................. Louisiana ............................................ Maryland ............................................. Mississippi .......................................... Missouri ..............................................
32,158 22,967
5,026 1,069 33,947 7,295 3,319 8,040 17,584 8,489
32,662 23,420
5,004 1,162 34,375 7,828 3,364 8,208 17,159 8,362
32,555 22,612
4,825 1,163 33,895 7,838 3,211 8,154 16,208 8,817
33,109 23,093
4,547 1,163 34,119 7,767 3,364 8,518 17,491 9,042
North Carolina ..................................... Oklahoma ........................................... Pennsylvania ...................................... South Carolina .................................... Texas .................................................. Virginia ................................................ California, Tennessee,
and West Virginia ..............................
24,740 6,444 6,284 5,672
17,370 6,357
12,462
23,914 7,290 6,508 5,747
16,718 6,322
12,723
23,424 6,874 6,373 5,550
16,942 6,157
11,346
24,646 6,863 6,335 5,312
17,045 5,990
12,399
Other States ........................................
11,378
11,407
12,321
11,076
United States ...................................... Percent of previous year .....................
230,601 99
232,173 100
228,265 98
Source: USDA National Agricultural Statistics Service, Broiler Hatchery, August 12, 2020
231,879 99
August 1, 2020
(1,000 eggs)
32,613 23,506
4,548 1,163 33,924 7,657 3,319 8,092 16,811 8,937
23,389 7,145 6,493 5,583
17,322 6,206
12,850
11,077
230,635 99
August 8, 2020
(1,000 eggs)
32,556 23,417
4,545 1,162 33,674 7,586 3,319 8,111 16,863 8,857
24,614 7,070 6,515 5,769
17,354 6,082
12,021
11,110
230,625 99
Broiler-Type Chicks Placed Selected States and United States: 2020
State
July 4, 2020
July 11, 2020
Week ending
July 18, 2020
July 25, 2020
(1,000 chicks) (1,000 chicks) (1,000 chicks) (1,000 chicks)
Alabama ............................................. Arkansas ............................................. Delaware ............................................ Florida ................................................. Georgia ............................................... Kentucky ............................................. Louisiana ............................................ Maryland ............................................. Mississippi .......................................... Missouri ..............................................
24,336 21,167
5,074 1,319 27,539 6,149 3,047 5,862 15,003 5,922
24,984 20,154
4,768 1,352 27,212 4,559 2,787 5,474 15,235 5,522
24,446 21,557
4,734 1,251 26,995 6,516 2,845 5,054 14,920 5,206
23,523 20,957
4,901 1,260 26,519 5,718 2,913 5,292 15,029 5,639
August 1, 2020
(1,000 chicks)
24,595 22,847
4,981 1,245 26,513 6,862 2,923 5,357 14,614 5,319
August 8, 2020
(1,000 chicks)
22,699 22,511
4,939 1,327 27,539 6,695 2,717 4,726 13,538 5,438
North Carolina ..................................... Oklahoma ........................................... Pennsylvania ...................................... South Carolina .................................... Texas .................................................. Virginia ................................................ California, Tennessee,
and West Virginia ..............................
20,864 4,497 4,483 4,831
14,846 5,562
11,529
19,543 5,261 5,006 5,427
15,732 6,463
10,721
19,284 3,347 4,878 5,567
14,808 6,467
10,975
19,727 3,909 4,829 5,041
14,172 5,832
11,167
19,295 3,182 4,923 4,939
13,827 5,814
10,673
19,659 3,151 4,898 4,672
13,824 6,426
9,124
Other States ........................................
9,157
9,400
9,297
8,991
8,988
9,778
United States ...................................... Percent of previous year .....................
191,187 102
189,600 100
188,147 101
Source: USDA National Agricultural Statistics Service, Broiler Hatchery, August 12, 2020
185,419 98
186,897 99
183,661 97