- Collection:
- Georgia Government Publications
- Serial:
- Broiler hatchery news release / United States Department of Agriculture National Agricultural Statistics Service.
- Title:
- Broiler hatchery news release, 2020 April 1
- Creator:
- United States. Department of Agriculture. National Agricultural Statistics Service. Southern Region
- Contributor to Resource:
- Georgia. Department of Agriculture
Florida. Department of Agriculture and Consumer Services
Alabama. Department of Agriculture and Industries
South Carolina. Department of Agriculture - Publisher:
- Athens, Ga. : United States. Department of Agriculture. National Agricultural Statistics Service. Southern Region
- Date of Original:
- 2020-04-01
- Subject:
- Chickens--Hatcheries--Southern States--Statistics--Periodicals
Broilers (Chickens)--Southern States--Statistics--Periodicals
Poultry industry--Southern States--Statistics--Periodicals - Location:
- United States, Georgia, 32.75042, -83.50018
- Medium:
- official reports
tables (documents) - Type:
- Text
- Format:
- application/pdf
- Description:
- Began with: August 28, 2013.
Effective March 12, 2014, name of issuing body appears as Southern Regional Field Office.
August 28, 2013; title from caption (Georgia Government Publications database, viewed January 19, 2018).
January 17, 2018 (received via e-mail on January 18, 2018 from Georgia Department of Agriculture); (Georgia Government Publications database, viewed November 22, 2017). - External Identifiers:
- Call Number GA A400.C7 P1 H2 2020/4-1
- Metadata URL:
- https://dlg.galileo.usg.edu/id:dlg_ggpd_i-ga-ba400-pc7-bp1-bh2-b2020-s4-h1-belec-p-btext
- Digital Object URL:
- https://dlg.galileo.usg.edu/do:dlg_ggpd_i-ga-ba400-pc7-bp1-bh2-b2020-s4-h1-belec-p-btext
- Language:
- eng
- Holding Institution:
- University of Georgia. Map and Government Information Library
- Rights:
-

United States Department of Agriculture National Agricultural Statistics Service
Southern Region News Release Broiler Hatchery
Cooperating with the Alabama Department of Agriculture and Industries, Florida Department of Agriculture and Consumer Services, Georgia Department of Agriculture, and South Carolina Department of Agriculture
Southern Regional Field Office 355 East Hancock Avenue, Suite 100 Athens, GA 30601 (706) 713-5400 www.nass.usda.gov
This report contains the results from the Weekly Broiler Hatchery Survey. Thanks to all who responded.
April 1, 2020
Media Contact: Anthony Prillaman
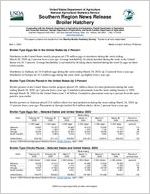
Broiler-Type Eggs Set in the United States Up 3 Percent
Hatcheries in the United States weekly program set 239 million eggs in incubators during the week ending March 28, 2020, up 3 percent from a year ago. Average hatchability for chicks hatched during the week in the United States was 81.3 percent. Average hatchability is calculated by dividing chicks hatched during the week by eggs set three weeks earlier.
Hatcheries in Alabama set 34.0 million eggs during the week ending March 28, 2020, up 12 percent from a year ago. Hatcheries in Georgia set 35.3 million eggs during the same week, up slightly from a year ago.
Broiler-Type Chicks Placed in the United States Up 3 Percent
Broiler growers in the United States weekly program placed 191 million chicks for meat production during the week ending March 28, 2020, up 3 percent from a year ago. Cumulative placements from the week ending January 4, 2020 through March 28, 2020 for the United States were 2.48 billion. Cumulative placements were up 4 percent from the same period a year earlier.
Broiler growers in Alabama placed 25.6 million chicks for meat production during the week ending March 28, 2020, up 13 percent from a year ago. Placements in Georgia totaled 26.6 million chicks, down 2 percent from a year ago.
Broiler-Type Eggs Set Selected States and United States: 2020
State
February 22, 2020
February 29, 2020
March 7, 2020
Week ending
March 14, 2020
(1,000 eggs)
(1,000 eggs)
(1,000 eggs)
(1,000 eggs)
Alabama .............. Florida ................. Georgia ............... South Carolina ....
33,887 1,191
35,004 5,513
34,075 1,209
35,334 5,809
34,066 1,225
35,323 5,643
34,216 1,207
34,849 5,751
United States ......
239,402
241,143
239,526
240,184
Source: USDA National Agricultural Statistics Service, Broiler Hatchery, April 1, 2020
March 21, 2020
(1,000 eggs)
33,290 1,194
35,080 5,804
238,844
March 28, 2020
(1,000 eggs)
34,043 1,177
35,250 5,834
239,462
Percent of previous year
(percent)
112 99
100 101
103
Broiler-Type Chicks Placed Selected States and United States: 2020
State
February 22, 2020
February 29, 2020
March 7, 2020
Week ending
March 14, 2020
March 21, 2020
(1,000 chicks) (1,000 chicks) (1,000 chicks) (1,000 chicks) (1,000 chicks)
Alabama .............. Florida ................. Georgia ............... South Carolina ....
25,635 1,316
25,987 5,301
24,510 1,349
27,625 5,263
24,465 1,314
27,638 4,644
24,988 1,225
27,068 5,265
24,923 1,325
28,120 4,441
United States ......
190,275
190,863
189,882
191,060
Source: USDA National Agricultural Statistics Service, Broiler Hatchery, April 1, 2020
191,626
March 28, 2020
(1,000 chicks)
25,585 1,335
26,602 4,881
190,915
Percent of previous year
(percent)
113 101
98 94
103
USDA is an equal opportunity provider and employer.
Broiler-Type Eggs Set Selected States and United States: 2020
State
February 22, 2020
February 29, 2020
Week ending
March 7, 2020
March 14, 2020
(1,000 eggs)
(1,000 eggs)
(1,000 eggs)
(1,000 eggs)
Alabama ................................................ Arkansas ............................................... Delaware ............................................... Florida .................................................... Georgia .................................................. Kentucky ................................................ Louisiana ............................................... Maryland ................................................ Mississippi ............................................. Missouri .................................................
33,887 24,495
5,223 1,191 35,004 7,870 3,774 7,970 17,915 8,849
34,075 24,192
5,430 1,209 35,334 7,873 3,744 8,495 18,354 8,890
34,066 24,285
5,063 1,225 35,323 7,111 3,850 8,503 18,257 9,096
34,216 23,858
5,306 1,207 34,849 7,760 3,879 8,486 18,082 8,809
North Carolina ....................................... Oklahoma .............................................. Pennsylvania ......................................... South Carolina ...................................... Texas ..................................................... Virginia .................................................. California, Tennessee,
and West Virginia ...............................
25,254 7,923 6,088 5,513
17,681 6,434
13,193
25,138 7,407 6,135 5,809
17,907 6,438
13,173
24,981 7,882 6,023 5,643
17,084 6,498
12,915
25,292 7,692 6,084 5,751
17,706 6,485
12,734
Other States ..........................................
11,138
11,540
11,721
11,988
United States ........................................ Percent of previous year ......................
239,402 103
241,143 104
239,526 103
Source: USDA National Agricultural Statistics Service, Broiler Hatchery, April 1, 2020
240,184 103
March 21, 2020
(1,000 eggs)
33,290 24,368
5,319 1,194 35,080 7,749 3,865 8,171 18,260 8,952
25,015 7,196 5,916 5,804
17,915 6,485
12,760
11,505
238,844 104
March 28, 2020
(1,000 eggs)
34,043 23,392
5,256 1,177 35,250 7,497 3,802 8,198 18,260 9,003
24,724 7,820 6,159 5,834
18,014 6,260
12,887
11,886
239,462 103
Broiler-Type Chicks Placed Selected States and United States: 2020
State
February 22, 2020
February 29, 2020
Week ending
March 7, 2020
March 14, 2020
(1,000 chicks) (1,000 chicks) (1,000 chicks) (1,000 chicks)
Alabama ................................................ Arkansas ............................................... Delaware ............................................... Florida .................................................... Georgia .................................................. Kentucky ................................................ Louisiana ............................................... Maryland ................................................ Mississippi ............................................. Missouri .................................................
25,635 22,190
6,108 1,316 25,987 6,612 3,357 5,024 14,984 5,800
24,510 22,396
5,574 1,349 27,625 6,435 3,281 4,683 15,127 5,596
24,465 22,025
4,854 1,314 27,638 6,555 3,297 5,761 15,513 5,989
24,988 21,417
4,939 1,225 27,068 6,073 3,269 5,051 14,888 5,935
March 21, 2020
(1,000 chicks)
24,923 22,029
5,318 1,325 28,120 5,912 3,234 5,875 15,182 5,655
March 28, 2020
(1,000 chicks)
25,585 22,848
4,967 1,335 26,602 5,601 3,352 5,421 15,191 6,437
North Carolina ....................................... Oklahoma .............................................. Pennsylvania ......................................... South Carolina ...................................... Texas ..................................................... Virginia .................................................. California, Tennessee,
and West Virginia ...............................
20,185 4,321 4,419 5,301
13,643 5,587
11,458
19,854 4,247 4,196 5,263
14,235 6,514
11,432
20,355 4,070 4,172 4,644
13,202 6,331
11,093
20,003 5,161 4,468 5,265
14,120 6,582
11,536
20,830 4,092 4,441 4,441
14,088 5,669
11,368
20,200 3,498 4,368 4,881
13,940 6,383
11,554
Other States ..........................................
8,348
8,546
8,604
9,072
9,124
8,752
United States ........................................ Percent of previous year ......................
190,275 103
190,863 104
189,882 103
Source: USDA National Agricultural Statistics Service, Broiler Hatchery, April 1, 2020
191,060 103
191,626 104
190,915 103