- Collection:
- Georgia Government Publications
- Serial:
- Broiler hatchery news release / United States Department of Agriculture National Agricultural Statistics Service.
- Title:
- Broiler hatchery news release, 2020 March 18
- Creator:
- United States. Department of Agriculture. National Agricultural Statistics Service. Southern Region
- Contributor to Resource:
- Georgia. Department of Agriculture
Florida. Department of Agriculture and Consumer Services
Alabama. Department of Agriculture and Industries
South Carolina. Department of Agriculture - Publisher:
- Athens, Ga. : United States. Department of Agriculture. National Agricultural Statistics Service. Southern Region
- Date of Original:
- 2020-03-18
- Subject:
- Chickens--Hatcheries--Southern States--Statistics--Periodicals
Broilers (Chickens)--Southern States--Statistics--Periodicals
Poultry industry--Southern States--Statistics--Periodicals - Location:
- United States, Georgia, 32.75042, -83.50018
- Medium:
- official reports
tables (documents) - Type:
- Text
- Format:
- application/pdf
- Description:
- Began with: August 28, 2013.
Effective March 12, 2014, name of issuing body appears as Southern Regional Field Office.
August 28, 2013; title from caption (Georgia Government Publications database, viewed January 19, 2018).
January 17, 2018 (received via e-mail on January 18, 2018 from Georgia Department of Agriculture); (Georgia Government Publications database, viewed November 22, 2017). - External Identifiers:
- Call Number GA A400.C7 P1 H2 2020/3-18
- Metadata URL:
- https://dlg.galileo.usg.edu/id:dlg_ggpd_i-ga-ba400-pc7-bp1-bh2-b2020-s3-h18-belec-p-btext
- Digital Object URL:
- https://dlg.galileo.usg.edu/do:dlg_ggpd_i-ga-ba400-pc7-bp1-bh2-b2020-s3-h18-belec-p-btext
- Language:
- eng
- Holding Institution:
- University of Georgia. Map and Government Information Library
- Rights:
-

United States Department of Agriculture National Agricultural Statistics Service
Southern Region News Release Broiler Hatchery
Cooperating with the Alabama Department of Agriculture and Industries, Florida Department of Agriculture and Consumer Services, Georgia Department of Agriculture, and South Carolina Department of Agriculture
Southern Regional Field Office 355 East Hancock Avenue, Suite 100 Athens, GA 30601 (706) 713-5400 www.nass.usda.gov
This report contains the results from the Weekly Broiler Hatchery Survey. Thanks to all who responded.
March 18, 2020
Media Contact: Anthony Prillaman
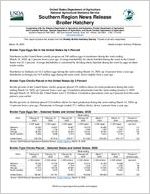
Broiler-Type Eggs Set in the United States Up 3 Percent
Hatcheries in the United States weekly program set 240 million eggs in incubators during the week ending March 14, 2020, up 3 percent from a year ago. Average hatchability for chicks hatched during the week in the United States was 81.3 percent. Average hatchability is calculated by dividing chicks hatched during the week by eggs set three weeks earlier.
Hatcheries in Alabama set 34.2 million eggs during the week ending March 14, 2020, up 14 percent from a year ago. Hatcheries in Georgia set 34.9 million eggs during the same week, down slightly from a year ago.
Broiler-Type Chicks Placed in the United States Up 3 Percent
Broiler growers in the United States weekly program placed 191 million chicks for meat production during the week ending March 14, 2020, up 3 percent from a year ago. Cumulative placements from the week ending January 4, 2020 through March 14, 2020 for the United States were 2.10 billion. Cumulative placements were up 4 percent from the same period a year earlier.
Broiler growers in Alabama placed 25.0 million chicks for meat production during the week ending March 14, 2020, up 14 percent from a year ago. Placements in Georgia totaled 27.1 million chicks, down 1 percent from a year ago.
Broiler-Type Eggs Set Selected States and United States: 2020
State
February 8, 2020
February 15, 2020
February 22, 2020
Week ending
February 29, 2020
(1,000 eggs)
(1,000 eggs)
(1,000 eggs)
(1,000 eggs)
Alabama ............. Florida ................ Georgia .............. South Carolina....
34,263 1,209
35,004 5,802
33,827 1,193
35,129 5,888
33,887 1,191
35,004 5,513
34,075 1,209
35,334 5,809
March 7, 2020
(1,000 eggs)
34,066 1,225
35,324 5,643
United States ......
239,736
237,916
239,311
241,060
Source: USDA National Agricultural Statistics Service, Broiler Hatchery, March 18, 2020
239,300
March 14, 2020
(1,000 eggs)
34,216 1,207
34,874 5,748
240,173
Percent of previous year
(percent)
114 101 100
97
103
Broiler-Type Chicks Placed Selected States and United States: 2020
State
February 8, 2020
February 15, 2020
February 22, 2020
Week ending
February 29, 2020
March 7, 2020
(1,000 chicks) (1,000 chicks) (1,000 chicks) (1,000 chicks) (1,000 chicks)
Alabama ............. Florida ................ Georgia .............. South Carolina....
25,402 1,297
27,510 4,542
24,750 1,281
28,702 5,279
25,635 1,316
25,984 5,301
24,510 1,349
27,625 5,263
24,465 1,314
27,638 4,644
United States ......
189,981
191,781
190,354
190,936
Source: USDA National Agricultural Statistics Service, Broiler Hatchery, March 18, 2020
189,959
March 14, 2020
(1,000 chicks)
24,988 1,225
27,136 4,823
190,947
Percent of previous year
(percent)
114 99 99
115
103
USDA is an equal opportunity provider and employer.
Broiler-Type Eggs Set Selected States and United States: 2020
State
February 8, 2020
February 15, 2020
Week ending
February 22, 2020
February 29, 2020
(1,000 eggs)
(1,000 eggs)
(1,000 eggs)
(1,000 eggs)
Alabama ............................................. Arkansas ............................................. Delaware ............................................ Florida ................................................. Georgia ............................................... Kentucky ............................................. Louisiana ............................................ Maryland ............................................. Mississippi .......................................... Missouri ..............................................
34,263 24,356
5,459 1,209 35,004 7,864 3,879 7,758 18,153 8,949
33,827 23,714
5,245 1,193 35,129 7,884 3,835 8,113 18,351 8,660
33,887 24,495
5,223 1,191 35,004 7,870 3,774 7,879 17,915 8,849
34,075 24,141
5,454 1,209 35,334 7,873 3,744 8,439 18,354 8,890
North Carolina ..................................... Oklahoma ........................................... Pennsylvania ...................................... South Carolina .................................... Texas .................................................. Virginia ................................................ California, Tennessee,
and West Virginia ..............................
25,078 7,507 5,893 5,802
17,846 6,508
13,315
24,763 7,464 5,741 5,888
17,250 6,512
13,243
25,254 7,923 6,088 5,513
17,681 6,434
13,193
25,138 7,407 6,135 5,809
17,907 6,438
13,173
Other States ........................................
10,893
11,104
11,138
11,540
United States ...................................... Percent of previous year .....................
239,736 105
237,916 103
239,311 103
Source: USDA National Agricultural Statistics Service, Broiler Hatchery, March 18, 2020
241,060 104
March 7, 2020
(1,000 eggs)
34,066 24,285
5,335 1,225 35,324 7,111 3,850 8,455 18,213 9,096
24,982 7,357 5,979 5,643
17,245 6,498
12,915
11,721
239,300 103
March 14, 2020
(1,000 eggs)
34,216 23,858
5,337 1,207 34,874 7,760 3,879 8,464 18,082 8,809
25,233 7,692 6,019 5,748
17,706 6,485
12,842
11,962
240,173 103
Broiler-Type Chicks Placed Selected States and United States: 2020
State
February 8, 2020
February 15, 2020
Week ending
February 22, 2020
February 29, 2020
(1,000 chicks) (1,000 chicks) (1,000 chicks) (1,000 chicks)
Alabama ............................................. Arkansas ............................................. Delaware ............................................ Florida ................................................. Georgia ............................................... Kentucky ............................................. Louisiana ............................................ Maryland ............................................. Mississippi .......................................... Missouri ..............................................
25,402 22,375
4,359 1,297 27,510 6,739 3,229 5,969 14,832 6,098
24,750 20,203
4,534 1,281 28,702 6,233 3,327 6,306 15,255 6,424
25,635 22,190
6,196 1,316 25,984 6,612 3,357 5,018 14,984 5,800
24,510 22,396
5,351 1,349 27,625 6,435 3,281 5,406 15,127 5,596
March 7, 2020
(1,000 chicks)
24,465 22,025
4,881 1,314 27,638 6,555 3,297 5,918 15,513 5,989
March 14, 2020
(1,000 chicks)
24,988 21,416
4,905 1,225 27,136 6,316 3,269 5,347 14,888 5,935
North Carolina ..................................... Oklahoma ........................................... Pennsylvania ...................................... South Carolina .................................... Texas .................................................. Virginia ................................................ California, Tennessee,
and West Virginia ..............................
20,004 3,705 4,353 4,542
13,842 6,235
11,174
19,736 5,401 4,427 5,279
14,387 5,851
11,513
20,185 4,321 4,419 5,301
13,643 5,587
11,458
19,854 4,247 4,196 5,263
14,235 6,087
11,432
20,348 4,070 4,174 4,644
13,202 6,231
11,093
20,506 5,161 4,466 4,823
14,122 5,914
11,585
Other States ........................................
8,316
8,172
8,348
8,546
8,602
8,945
United States ...................................... Percent of previous year .....................
189,981 104
191,781 104
190,354 103
Source: USDA National Agricultural Statistics Service, Broiler Hatchery, March 18, 2020
190,936 104
189,959 103
190,947 103