- Collection:
- Georgia Government Publications
- Serial:
- Broiler hatchery news release / United States Department of Agriculture National Agricultural Statistics Service.
- Title:
- Broiler hatchery news release, 2020 February 5
- Creator:
- United States. Department of Agriculture. National Agricultural Statistics Service. Southern Region
- Contributor to Resource:
- Georgia. Department of Agriculture
Florida. Department of Agriculture and Consumer Services
Alabama. Department of Agriculture and Industries
South Carolina. Department of Agriculture - Publisher:
- Athens, Ga. : United States. Department of Agriculture. National Agricultural Statistics Service. Southern Region
- Date of Original:
- 2020-02-05
- Subject:
- Chickens--Hatcheries--Southern States--Statistics--Periodicals
Broilers (Chickens)--Southern States--Statistics--Periodicals
Poultry industry--Southern States--Statistics--Periodicals - Location:
- United States, Georgia, 32.75042, -83.50018
- Medium:
- official reports
tables (documents) - Type:
- Text
- Format:
- application/pdf
- Description:
- This news release contains Georgia agricultural statistics.
- External Identifiers:
- Call Number GA A400.C7 P1 H2 2020/2-5
- Metadata URL:
- https://dlg.galileo.usg.edu/id:dlg_ggpd_i-ga-ba400-pc7-bp1-bh2-b2020-s2-h5-belec-p-btext
- Digital Object URL:
- https://dlg.galileo.usg.edu/do:dlg_ggpd_i-ga-ba400-pc7-bp1-bh2-b2020-s2-h5-belec-p-btext
- Language:
- eng
- Holding Institution:
- University of Georgia. Map and Government Information Library
- Rights:
-

United States Department of Agriculture National Agricultural Statistics Service
Southern Region News Release Broiler Hatchery
Cooperating with the Alabama Department of Agriculture and Industries, Florida Department of Agriculture and Consumer Services, Georgia Department of Agriculture, and South Carolina Department of Agriculture
Southern Regional Field Office 355 East Hancock Avenue, Suite 100 Athens, GA 30601 (706) 713-5400 www.nass.usda.gov
February 5, 2020
Media Contact: Anthony Prillaman
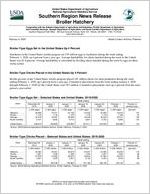
Broiler-Type Eggs Set in the United States Up 4 Percent
Hatcheries in the United States weekly program set 239 million eggs in incubators during the week ending February 1, 2020, up 4 percent from a year ago. Average hatchability for chicks hatched during the week in the United States was 81.8 percent. Average hatchability is calculated by dividing chicks hatched during the week by eggs set three weeks earlier.
Broiler-Type Chicks Placed in the United States Up 4 Percent
Broiler growers in the United States weekly program placed 192 million chicks for meat production during the week ending February 1, 2020, up 4 percent from a year ago. Cumulative placements from the week ending January 4, 2020 through February 1, 2020 for the United States were 953 million. Cumulative placements were up 4 percent from the same period a year earlier.
Broiler-Type Eggs Set Selected States and United States: 2019-2020
State
December 28, 2019
January 4, 2020
January 11, 2020
Week ending
January 18, 2020
January 25, 2020
(1,000 eggs)
(1,000 eggs)
(1,000 eggs)
(1,000 eggs)
(1,000 eggs)
Alabama ............. Florida ................ Georgia .............. South Carolina....
33,999 1,178
34,576 5,437
34,071 1,178
35,291 5,602
34,108 1,178
35,006 5,412
34,032 1,178
34,648 5,621
34,255 1,178
35,549 5,753
United States ......
238,819
236,829
239,399
237,511
Source: USDA National Agricultural Statistics Service, Broiler Hatchery, February 5, 2020
240,500
February 1, 2020
(1,000 eggs)
33,619 1,168
35,214 5,889
238,586
Percent of previous year
(percent)
107 97
102 104
104
Broiler-Type Chicks Placed Selected States and United States: 2019-2020
State
December 28, 2019
January 4, 2020
January 11, 2020
Week ending
January 18, 2020
January 25, 2020
(1,000 chicks) (1,000 chicks) (1,000 chicks) (1,000 chicks) (1,000 chicks)
Alabama ............. Florida ................ Georgia .............. South Carolina....
23,383 1,281
27,678 4,691
25,321 1,232
24,563 4,878
25,818 1,336
26,672 4,907
24,637 1,334
26,940 5,133
24,933 1,297
27,364 5,402
United States ......
189,066
189,728
190,869
191,158
Source: USDA National Agricultural Statistics Service, Broiler Hatchery, February 5, 2020
189,136
February 1, 2020
(1,000 chicks)
25,233 1,223
26,272 4,679
192,130
Percent of previous year
(percent)
110 92 95 98
104
USDA is an equal opportunity provider and employer. All NASS reports are available, at no cost, on the NASS website: http://www.nass.usda.gov
Broiler-Type Eggs Set Selected States and United States: 2019-2020
State
December 28, 2019
January 4, 2020
Week ending
January 11, 2020
January 18, 2020
(1,000 eggs)
(1,000 eggs)
(1,000 eggs)
(1,000 eggs)
Alabama ............................................. Arkansas ............................................. Delaware ............................................ Florida ................................................. Georgia ............................................... Kentucky ............................................. Louisiana ............................................ Maryland ............................................. Mississippi .......................................... Missouri ..............................................
33,999 23,860
5,609 1,178 34,576 7,912 3,819 8,121 17,749 8,952
34,071 23,890
5,490 1,178 35,291 7,684 3,758 8,090 18,185 8,618
34,108 23,992
5,488 1,178 35,006 7,910 3,740 8,280 18,199 8,905
34,032 24,038
5,499 1,178 34,648 7,944 3,819 8,131 17,550 8,646
North Carolina ..................................... Oklahoma ........................................... Pennsylvania ...................................... South Carolina .................................... Texas .................................................. Virginia ................................................ California, Tennessee,
and West Virginia ..............................
25,047 7,781 6,189 5,437
18,132 6,468
13,116
23,339 7,595 6,082 5,602
17,987 6,302
12,449
25,070 7,521 6,204 5,412
17,976 6,453
12,821
25,165 7,572 6,122 5,621
17,296 6,454
12,916
Other States ........................................
10,874
11,218
11,136
10,880
United States ...................................... Percent of previous year .....................
238,819 104
236,829 104
239,399 105
Source: USDA National Agricultural Statistics Service, Broiler Hatchery, February 5, 2020
237,511 104
January 25, 2020
(1,000 eggs)
34,255 23,378
5,484 1,178 35,549 7,989 3,864 8,179 18,305 8,914
25,106 7,837 6,204 5,753
17,992 6,453
13,269
10,791
240,500 105
February 1, 2020
(1,000 eggs)
33,619 23,550
5,514 1,168 35,214 7,905 3,879 8,245 18,124 8,778
24,994 7,756 6,251 5,889
17,369 6,469
13,019
10,843
238,586 104
Broiler-Type Chicks Placed Selected States and United States: 2019-2020
State
December 28, 2019
January 4, 2020
Week ending
January 11, 2020
January 18, 2020
(1,000 chicks) (1,000 chicks) (1,000 chicks) (1,000 chicks)
Alabama ............................................. Arkansas ............................................. Delaware ............................................ Florida ................................................. Georgia ............................................... Kentucky ............................................. Louisiana ............................................ Maryland ............................................. Mississippi .......................................... Missouri ..............................................
23,383 21,831
5,361 1,281 27,678 6,283 3,115 6,079 15,380 5,950
25,321 23,862
6,130 1,232 24,563 6,670 3,200 5,253 15,482 5,812
25,818 21,865
5,097 1,336 26,672 6,295 3,193 6,792 15,811 6,243
24,637 22,429
5,592 1,334 26,940 5,923 3,238 5,945 15,116 5,873
January 25, 2020
(1,000 chicks)
24,933 21,273
4,902 1,297 27,364 5,839 3,192 6,335 15,507 5,464
February 1, 2020
(1,000 chicks)
25,233 22,939
5,765 1,223 26,272 5,683 3,201 5,533 15,472 5,135
North Carolina ..................................... Oklahoma ........................................... Pennsylvania ...................................... South Carolina .................................... Texas .................................................. Virginia ................................................ California, Tennessee,
and West Virginia ..............................
19,592 4,333 4,514 4,691
14,633 5,176
11,205
20,123 3,477 4,418 4,878
14,700 5,159
11,122
20,201 4,314 4,461 4,907
14,629 4,986
10,080
19,949 4,212 4,323 5,133
14,729 5,161
12,028
18,404 5,396 4,419 5,402
14,423 5,470
10,609
20,582 4,388 4,461 4,679
14,634 6,104
12,000
Other States ........................................
8,581
8,326
8,169
8,596
8,907
8,826
United States ...................................... Percent of previous year .....................
189,066 107
189,728 105
190,869 104
Source: USDA National Agricultural Statistics Service, Broiler Hatchery, February 5, 2020
191,158 104
189,136 103
192,130 104