- Collection:
- Georgia Government Publications
- Serial:
- Broiler hatchery news release / United States Department of Agriculture National Agricultural Statistics Service.
- Title:
- Broiler hatchery news release, 2020 January 22
- Creator:
- United States. Department of Agriculture. National Agricultural Statistics Service. Southern Region
- Contributor to Resource:
- Georgia. Department of Agriculture
Florida. Department of Agriculture and Consumer Services
Alabama. Department of Agriculture and Industries
South Carolina. Department of Agriculture - Publisher:
- Athens, Ga. : United States. Department of Agriculture. National Agricultural Statistics Service. Southern Region
- Date of Original:
- 2020-01-22
- Subject:
- Chickens--Hatcheries--Southern States--Statistics--Periodicals
Broilers (Chickens)--Southern States--Statistics--Periodicals
Poultry industry--Southern States--Statistics--Periodicals - Location:
- United States, Georgia, 32.75042, -83.50018
- Medium:
- official reports
tables (documents) - Type:
- Text
- Format:
- application/pdf
- Description:
- This news release contains Georgia agricultural statistics.
- External Identifiers:
- Call Number GA A400.C7 P1 H2 2020/1-22
- Metadata URL:
- https://dlg.galileo.usg.edu/id:dlg_ggpd_i-ga-ba400-pc7-bp1-bh2-b2020-s1-h22-belec-p-btext
- Digital Object URL:
- https://dlg.galileo.usg.edu/do:dlg_ggpd_i-ga-ba400-pc7-bp1-bh2-b2020-s1-h22-belec-p-btext
- Language:
- eng
- Holding Institution:
- University of Georgia. Map and Government Information Library
- Rights:
-

United States Department of Agriculture National Agricultural Statistics Service
Southern Region News Release Broiler Hatchery
Cooperating with the Alabama Department of Agriculture and Industries, Florida Department of Agriculture and Consumer Services, Georgia Department of Agriculture, and South Carolina Department of Agriculture
Southern Regional Field Office 355 East Hancock Avenue, Suite 100 Athens, GA 30601 (706) 713-5400 www.nass.usda.gov
January 22. 2020
Media Contact: Anthony Prillaman
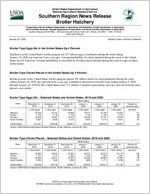
Broiler-Type Eggs Set in the United States Up 4 Percent
Hatcheries in the United States weekly program set 237 million eggs in incubators during the week ending January 18, 2020, up 4 percent from a year ago. Average hatchability for chicks hatched during the week in the United States was 81.9 percent. Average hatchability is calculated by dividing chicks hatched during the week by eggs set three weeks earlier.
Broiler-Type Chicks Placed in the United States Up 4 Percent
Broiler growers in the United States weekly program placed 191 million chicks for meat production during the week ending January 18, 2020, up 4 percent from a year ago. Cumulative placements from the week ending January 4, 2020 through January 18, 2020 for the United States were 571 million. Cumulative placements were up 4 percent from the same period a year earlier.
Broiler-Type Eggs Set Selected States and United States: 2019 and 2020
State
December 14, 2019
December 21, 2019
December 28, 2019
Week ending
January 4, 2020
January 11, 2020
(1,000 eggs)
(1,000 eggs)
(1,000 eggs)
(1,000 eggs)
(1,000 eggs)
Alabama ............. Florida ................ Georgia .............. South Carolina....
34,035 1,178
32,629 5,827
34,131 1,178
35,037 5,898
33,999 1,178
34,576 5,437
34,071 1,178
35,038 5,602
34,108 1,178
34,751 5,412
United States ......
237,501
239,306
238,201
236,353
Source: USDA National Agricultural Statistics Service, Broiler Hatchery, January 22, 2020
238,676
January 18, 2020
(1,000 eggs)
34,063 1,178
34,649 5,621
236,697
Percent of previous year
(percent)
113 99 98 96
104
Broiler-Type Chicks Placed Selected States and United States: 2019 and 2020
State
December 14, 2019
December 21, 2019
December 28, 2019
Week ending
January 4, 2020
January 11, 2020
January 18, 2020
(1,000 chicks) (1,000 chicks) (1,000 chicks) (1,000 chicks) (1,000 chicks) (1,000 chicks)
Alabama ............. Florida ................ Georgia .............. South Carolina....
24,894 1,317
26,466 5,503
25,640 1,417
26,511 4,832
23,383 1,283
27,678 4,696
25,321 1,233
24,563 4,885
25,818 1,333
26,669 4,711
24,472 1,334
27,322 4,939
United States ......
189,338
190,152
188,887
189,548
Source: USDA National Agricultural Statistics Service, Broiler Hatchery, January 22, 2020
190,647
191,128
Percent of previous year
(percent)
106 99 99
115
104
USDA is an equal opportunity provider and employer. All NASS reports are available, at no cost, on the NASS website: http://www.nass.usda.gov
Broiler-Type Eggs Set Selected States and United States: 2019-2020
State
December 14, 2019
December 21, 2019
Week ending
December 28, 2019
January 4, 2020
(1,000 eggs)
(1,000 eggs)
(1,000 eggs)
(1,000 eggs)
Alabama ............................................. Arkansas ............................................. Delaware ............................................ Florida ................................................. Georgia ............................................... Kentucky ............................................. Louisiana ............................................ Maryland ............................................. Mississippi .......................................... Missouri ..............................................
34,035 24,064
5,489 1,178 32,629 8,014 3,774 7,671 18,243 8,983
34,131 23,818
5,610 1,178 35,037 7,931 3,774 8,113 18,538 8,934
33,999 23,860
5,468 1,178 34,576 7,912 3,819 8,121 17,749 8,952
34,071 23,850
5,468 1,178 35,038 7,684 3,758 8,090 18,185 8,618
North Carolina ..................................... Oklahoma ........................................... Pennsylvania ...................................... South Carolina .................................... Texas .................................................. Virginia ................................................ California, Tennessee,
and West Virginia ..............................
25,130 7,879 5,868 5,827
18,398 6,484
12,809
25,161 7,860 6,244 5,898
18,192 6,257
11,832
25,047 7,781 5,712 5,437
18,132 6,468
13,116
23,339 7,595 5,921 5,602
17,987 6,302
12,449
Other States ........................................
11,026
10,798
10,874
11,218
United States ...................................... Percent of previous year .....................
237,501 106
239,306 105
238,201 104
Source: USDA National Agricultural Statistics Service, Broiler Hatchery, January 22, 2020
236,353 104
January 11, 2020
(1,000 eggs)
34,108 23,992
5,483 1,178 34,751 7,910 3,740 8,280 18,199 8,905
25,070 7,521 5,903 5,412
17,976 6,453
12,821
10,974
238,676 104
January 18, 2020
(1,000 eggs)
34,063 23,956
5,499 1,178 34,649 7,897 3,819 8,131 17,550 8,647
25,174 7,572 5,933 5,621
17,326 6,454
12,395
10,833
236,697 104
Broiler-Type Chicks Placed Selected States and United States: 2019-2020
State
December 14, 2019
December 21, 2019
Week ending
December 28, 2019
January 4, 2020
(1,000 chicks) (1,000 chicks) (1,000 chicks) (1,000 chicks)
Alabama ............................................. Arkansas ............................................. Delaware ............................................ Florida ................................................. Georgia ............................................... Kentucky ............................................. Louisiana ............................................ Maryland ............................................. Mississippi .......................................... Missouri ..............................................
24,894 21,580
4,607 1,317 26,466 6,239 3,271 6,198 15,398 6,622
25,640 21,745
5,052 1,417 26,511 6,211 3,164 6,075 15,426 5,753
23,383 21,831
5,277 1,283 27,678 6,283 3,115 6,017 15,380 5,950
25,321 23,862
5,998 1,233 24,563 6,670 3,200 5,249 15,482 5,812
January 11, 2020
(1,000 chicks)
25,818 21,865
5,091 1,333 26,669 6,294 3,192 6,794 15,811 6,243
January 18, 2020
(1,000 chicks)
24,472 21,672
5,664 1,334 27,322 6,499 3,238 5,936 15,171 6,341
North Carolina ..................................... Oklahoma ........................................... Pennsylvania ...................................... South Carolina .................................... Texas .................................................. Virginia ................................................ California, Tennessee,
and West Virginia ..............................
19,649 4,281 4,290 5,503
14,179 5,463
11,075
19,690 4,292 4,476 4,832
14,239 6,297
11,131
19,594 4,333 4,515 4,696
14,633 5,186
11,148
20,124 3,477 4,305 4,885
14,700 5,283
11,057
20,201 4,313 4,504 4,711
14,628 4,830
10,178
19,969 4,300 4,267 4,939
14,698 5,107
11,828
Other States ........................................
8,306
8,201
8,585
8,327
8,172
8,371
United States ...................................... Percent of previous year .....................
189,338 103
190,152 100
188,887 107
Source: USDA National Agricultural Statistics Service, Broiler Hatchery, January 22, 2020
189,548 105
190,647 104
191,128 104