- Collection:
- Georgia Government Publications
- Serial:
- Broiler hatchery news release / United States Department of Agriculture National Agricultural Statistics Service.
- Title:
- Broiler hatchery news release, 2020 January 2
- Creator:
- United States. Department of Agriculture. National Agricultural Statistics Service. Southern Region
- Contributor to Resource:
- Georgia. Department of Agriculture
Florida. Department of Agriculture and Consumer Services
Alabama. Department of Agriculture and Industries
South Carolina. Department of Agriculture - Publisher:
- Athens, Ga. : United States. Department of Agriculture. National Agricultural Statistics Service. Southern Region
- Date of Original:
- 2020-01-02
- Subject:
- Chickens--Hatcheries--Southern States--Statistics--Periodicals
Broilers (Chickens)--Southern States--Statistics--Periodicals
Poultry industry--Southern States--Statistics--Periodicals - Location:
- United States, Georgia, 32.75042, -83.50018
- Medium:
- official reports
tables (documents) - Type:
- Text
- Format:
- application/pdf
- Description:
- This news release contains Georgia agricultural statistics.
- External Identifiers:
- Call Number GA A400.C7 P1 H2 2020/1-2
- Metadata URL:
- https://dlg.galileo.usg.edu/id:dlg_ggpd_i-ga-ba400-pc7-bp1-bh2-b2020-s1-h2-belec-p-btext
- Digital Object URL:
- https://dlg.galileo.usg.edu/do:dlg_ggpd_i-ga-ba400-pc7-bp1-bh2-b2020-s1-h2-belec-p-btext
- Language:
- eng
- Holding Institution:
- University of Georgia. Map and Government Information Library
- Rights:
-

United States Department of Agriculture National Agricultural Statistics Service
Southern Region News Release Broiler Hatchery
Cooperating with the Alabama Department of Agriculture and Industries, Florida Department of Agriculture and Consumer Services, Georgia Department of Agriculture, and South Carolina Department of Agriculture
Southern Regional Field Office 355 East Hancock Avenue, Suite 100 Athens, GA 30601 (706) 713-5400 www.nass.usda.gov
January 2, 2020
Media Contact: Anthony Prillaman
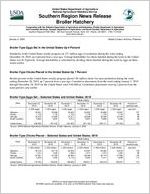
Broiler-Type Eggs Set in the United States Up 4 Percent
Hatcheries in the United States weekly program set 237 million eggs in incubators during the week ending December 28, 2019, up 4 percent from a year ago. Average hatchability for chicks hatched during the week in the United States was 81.9 percent. Average hatchability is calculated by dividing chicks hatched during the week by eggs set three weeks earlier.
Broiler-Type Chicks Placed in the United States Up 7 Percent
Broiler growers in the United States weekly program placed 189 million chicks for meat production during the week ending December 28, 2019, up 7 percent from a year ago. Cumulative placements from the week ending January 5, 2019 through December 28, 2019 for the United States were 9.66 billion. Cumulative placements were up 2 percent from the same period a year earlier.
Broiler-Type Eggs Set Selected States and United States: 2019
State
November 23, 2019
November 30, 2019
December 7, 2019
Week ending
December 14, 2019
(1,000 eggs)
(1,000 eggs)
(1,000 eggs)
(1,000 eggs)
Alabama ............. Florida ................ Georgia .............. South Carolina....
33,501 1,178
34,915 5,693
33,566 1,178
34,952 5,807
33,293 1,178
34,371 5,512
33,602 1,178
32,629 5,827
December 21, 2019
(1,000 eggs)
33,696 1,178
35,038 5,886
United States ......
236,955
237,420
234,222
237,106
Source: USDA National Agricultural Statistics Service, Broiler Hatchery, January 2, 2020
239,141
December 28, 2019
(1,000 eggs)
33,567 1,178
34,549 5,396
237,300
Percent of previous year
(percent)
107 99 99 92
104
Broiler-Type Chicks Placed Selected States and United States: 2019
State
November 23, 2019
November 30, 2019
December 7, 2019
Week ending
December 14, 2019
December 21, 2019
(1,000 chicks) (1,000 chicks) (1,000 chicks) (1,000 chicks) (1,000 chicks)
Alabama ............. Florida ................ Georgia .............. South Carolina....
22,319 1,214
24,551 5,229
22,119 1,325
27,332 4,320
25,329 1,338
26,260 5,118
24,507 1,317
26,466 5,503
25,360 1,310
26,719 4,311
United States ......
179,793
183,645
188,638
188,941
Source: USDA National Agricultural Statistics Service, Broiler Hatchery, January 2, 2020
189,318
December 28, 2019
(1,000 chicks)
23,016 1,284
27,660 5,098
188,557
Percent of previous year
(percent)
103 98
105 113
107
USDA is an equal opportunity provider and employer. All NASS reports are available, at no cost, on the NASS website: http://www.nass.usda.gov
Broiler-Type Eggs Set Selected States and United States: 2019
State
November 23, 2019
November 30, 2019
Week ending
December 7, 2019
December 14, 2019
(1,000 eggs)
(1,000 eggs)
(1,000 eggs)
(1,000 eggs)
Alabama ............................................. Arkansas ............................................. Delaware ............................................ Florida ................................................. Georgia ............................................... Kentucky ............................................. Louisiana ............................................ Maryland ............................................. Mississippi .......................................... Missouri ..............................................
33,501 23,858
5,470 1,178 34,915 7,806 3,864 7,931 18,006 8,952
33,566 23,540
5,466 1,178 34,952 7,747 3,758 8,096 18,015 8,664
33,293 23,312
5,467 1,178 34,371 7,268 3,668 7,846 18,275 8,929
33,602 24,064
5,469 1,178 32,629 8,014 3,774 7,671 18,243 8,983
December 21, 2019
(1,000 eggs)
33,696 23,818
5,469 1,178 35,038 7,933 3,774 7,759 18,538 8,934
December 28, 2019
(1,000 eggs)
33,567 23,860
5,468 1,178 34,549 7,896 3,819 7,971 17,749 8,952
North Carolina ..................................... Oklahoma ........................................... Pennsylvania ...................................... South Carolina .................................... Texas .................................................. Virginia ................................................ California, Tennessee,
and West Virginia ..............................
24,798 7,765 5,791 5,693
17,781 5,903
12,925
24,735 7,573 5,976 5,807
17,934 6,682
12,769
24,338 7,200 6,021 5,512
18,115 6,134
12,177
25,187 7,879 5,868 5,827
18,398 6,484
12,810
25,017 7,860 6,085 5,886
18,192 6,257
12,870
24,898 7,781 5,712 5,396
18,132 6,468
12,790
Other States ........................................
10,818
10,962
11,118
11,026
10,837
11,114
United States ...................................... Percent of previous year .....................
236,955 104
237,420 101
234,222 107
Source: USDA National Agricultural Statistics Service, Broiler Hatchery, January 2, 2020
237,106 105
239,141 104
237,300 104
Broiler-Type Chicks Placed Selected States and United States: 2019
State
November 23, 2019
November 30, 2019
Week ending
December 7, 2019
December 14, 2019
(1,000 chicks) (1,000 chicks) (1,000 chicks) (1,000 chicks)
Alabama ............................................. Arkansas ............................................. Delaware ............................................ Florida ................................................. Georgia ............................................... Kentucky ............................................. Louisiana ............................................ Maryland ............................................. Mississippi .......................................... Missouri ..............................................
22,319 21,213
4,955 1,214 24,551 6,125 2,743 5,917 14,708 4,815
22,119 21,254
5,454 1,325 27,332 5,880 2,963 5,506 14,891 5,194
25,329 21,991
4,901 1,338 26,260 6,095 2,925 6,202 15,400 6,046
24,507 21,580
4,601 1,317 26,466 6,239 3,271 6,194 15,398 6,622
December 21, 2019
(1,000 chicks)
25,360 21,745
5,350 1,310 26,719 6,231 3,164 6,018 15,426 5,753
December 28, 2019
(1,000 chicks)
23,016 21,831
5,196 1,284 27,660 6,476 3,115 6,062 15,380 5,950
North Carolina ..................................... Oklahoma ........................................... Pennsylvania ...................................... South Carolina .................................... Texas .................................................. Virginia ................................................ California, Tennessee,
and West Virginia ..............................
19,324 4,936 4,127 5,229
14,084 5,306
10,859
20,613 5,020 4,333 4,320
13,169 5,870
10,100
19,293 4,420 4,533 5,118
13,891 4,995
11,104
19,649 4,281 4,290 5,503
14,179 5,463
11,075
20,069 4,292 4,347 4,311
14,239 5,979
10,826
19,303 4,333 4,515 5,098
14,633 5,084
11,143
Other States ........................................
7,368
8,302
8,797
8,306
8,179
8,478
United States ...................................... Percent of previous year .....................
179,793 104
183,645 103
188,638 103
Source: USDA National Agricultural Statistics Service, Broiler Hatchery, January 2, 2020
188,941 103
189,318 100
188,557 107