- Collection:
- Georgia Government Publications
- Serial:
- Broiler hatchery news release / United States Department of Agriculture National Agricultural Statistics Service.
- Title:
- Broiler hatchery news release, 2019 August 7
- Creator:
- United States. Department of Agriculture. National Agricultural Statistics Service. Southern Region
- Contributor to Resource:
- Georgia. Department of Agriculture
Florida. Department of Agriculture and Consumer Services
Alabama. Department of Agriculture and Industries
South Carolina. Department of Agriculture - Publisher:
- Athens, Ga. : United States. Department of Agriculture. National Agricultural Statistics Service. Southern Region
- Date of Original:
- 2019-08-07
- Subject:
- Chickens--Hatcheries--Southern States--Statistics--Periodicals
Broilers (Chickens)--Southern States--Statistics--Periodicals
Poultry industry--Southern States--Statistics--Periodicals - Location:
- United States, Georgia, 32.75042, -83.50018
- Medium:
- official reports
tables (documents) - Type:
- Text
- Format:
- application/pdf
- Description:
- This news release contains Georgia agricultural statistics.
- External Identifiers:
- Call Number GA A400.C7 P1 H2 2019/8-7
- Metadata URL:
- https://dlg.galileo.usg.edu/id:dlg_ggpd_i-ga-ba400-pc7-bp1-bh2-b2019-s8-h7-belec-p-btext
- Digital Object URL:
- https://dlg.galileo.usg.edu/do:dlg_ggpd_i-ga-ba400-pc7-bp1-bh2-b2019-s8-h7-belec-p-btext
- Language:
- eng
- Holding Institution:
- University of Georgia. Map and Government Information Library
- Rights:
-

United States Department of Agriculture National Agricultural Statistics Service
Southern Region News Release Broiler Hatchery
Cooperating with the Alabama Department of Agriculture and Industries, Florida Department of Agriculture and Consumer Services, Georgia Department of Agriculture, and South Carolina Department of Agriculture
Southern Regional Field Office 355 East Hancock Avenue, Suite 100 Athens, GA 30601 (706) 546-2236 www.nass.usda.gov
August 7, 2019
Media Contact: Jacqueline Moore
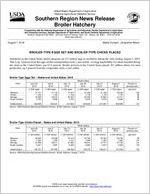
BROILER-TYPE EGGS SET AND BROILER-TYPE CHICKS PLACED
Hatcheries in the United States weekly program set 232 million eggs in incubators during the week ending August 3, 2019. This is up 1 percent from the eggs set the corresponding week a year earlier. Average hatchability for chicks hatched during the week in the United States was 82.4 percent. Broiler growers in the United States placed 187 million chicks for meat production, up 2 percent from the comparable week a year earlier.
Broiler-Type Eggs Set States and United States: 2019
State
Alabama ............. Florida ................ Georgia .............. South Carolina....
June 29, 2019
(1,000 eggs)
31,191 1,163
34,585 5,703
July 6, 2019
(1,000 eggs)
31,149 1,163
35,610 5,892
July 13, 2019
(1,000 eggs)
31,044 1,163
34,945 5,794
Week ending
July 20, 2019
(1,000 eggs)
31,338 1,178
35,463 5,645
United States ......
229,298
232,937
231,823
233,630
Source: USDA National Agricultural Statistics Service, Broiler Hatchery, August 7, 2019.
July 27, 2019
(1,000 eggs)
31,190 1,178
34,903 5,676
231,887
August 3, 2019
(1,000 eggs)
30,539 1,178
34,741 5,668
232,085
Percent of previous year
(percent)
100 96 99 98
101
Broiler-Type Chicks Placed States and United States: 2019
State
June 29, 2019
July 6, 2019
July 13, 2019
Week ending
July 20, 2019
(1,000 chicks) (1,000 chicks) (1,000 chicks) (1,000 chicks)
Alabama ............. Florida ................ Georgia .............. South Carolina....
23,595 1,294
27,826 5,047
22,988 1,300
28,011 4,897
23,418 1,167
27,995 5,058
22,790 1,289
26,644 5,880
United States ......
189,707
187,590
188,488
185,278
Source: USDA National Agricultural Statistics Service, Broiler Hatchery, August 7, 2019.
July 27, 2019
(1,000 chicks)
23,483 1,303
27,474 4,670
188,814
August 3, 2019
(1,000 chicks)
22,736 1,303
27,730 4,805
187,299
Percent of previous year
(percent)
98 104 101 100
102
USDA is an equal opportunity provider and employer. All NASS reports are available, at no cost, on the NASS website: http://www.nass.usda.gov
Broiler-Type Eggs Set Selected States and United States: 2019
State
June 29, 2019
July 6, 2019
Week ending
July 13, 2019
July 20, 2019
(1,000 eggs)
(1,000 eggs)
(1,000 eggs)
(1,000 eggs)
Alabama ............................................ Arkansas ............................................ Delaware ............................................ Florida ............................................... Georgia .............................................. Kentucky ............................................. Louisiana ............................................ Maryland ............................................. Mississippi .......................................... Missouri ..............................................
31,191 24,587
5,085 1,163 34,585 7,944 3,364 7,637 18,374 8,628
31,149 25,036
5,058 1,163 35,610 7,815 3,682 7,659 18,705 8,485
31,044 24,801
5,058 1,163 34,945 7,831 3,712 7,920 18,263 8,297
31,338 24,739
5,366 1,178 35,463 7,756 3,727 8,068 18,276 8,631
North Carolina .................................... Oklahoma ........................................... Pennsylvania ...................................... South Carolina .................................. Texas ................................................. Virginia ............................................... California, Tennessee,
and West Virginia ..............................
23,415 7,647 5,113 5,703
17,222 6,425
12,359
23,385 7,698 5,608 5,892
17,645 6,274
12,272
23,608 7,513 5,619 5,794
17,548 6,423
12,640
23,982 7,648 5,836 5,645
17,338 6,425
12,657
Other States .......................................
8,856
9,801
9,644
9,557
United States ...................................... Percent of previous year .....................
229,298 100
232,937 101
231,823 102
233,630 102
July 27, 2019
(1,000 eggs)
31,190 24,775
5,152 1,178 34,903 7,460 3,619 7,834 18,566 8,618
23,800 7,237 5,506 5,676
17,640 6,425
12,545
9,763
231,887 101
August 3, 2019
(1,000 eggs)
30,539 24,989
5,200 1,178 34,741 7,814 3,713 8,097 18,475 8,614
23,886 7,617 5,557 5,668
17,558 6,349
12,299
9,791
232,085 101
Broiler-Type Chicks Placed Selected States and United States: 2019
State
June 29, 2019
July 6, 2019
Week ending
July 13, 2019
July 20, 2019
(1,000 chicks) (1,000 chicks) (1,000 chicks) (1,000 chicks)
Alabama ............................................ Arkansas ............................................ Delaware ............................................ Florida ............................................... Georgia .............................................. Kentucky ............................................. Louisiana ............................................ Maryland ............................................. Mississippi .......................................... Missouri ..............................................
23,595 22,791
5,493 1,294 27,826 6,205 3,333 5,128 16,159 6,586
22,988 20,092
4,593 1,300 28,011 6,497 3,254 6,224 15,756 6,340
23,418 21,709
4,652 1,167 27,995 5,712 3,400 6,182 15,842 5,778
22,790 21,846
4,537 1,289 26,644 6,068 2,955 5,245 15,718 5,718
July 27, 2019
(1,000 chicks)
23,483 23,584
4,562 1,303 27,474 6,565 3,213 5,323 16,021 5,834
August 3, 2019
(1,000 chicks)
22,736 23,546
5,159 1,303 27,730 6,860 3,228 5,786 15,319 6,104
North Carolina .................................... Oklahoma ........................................... Pennsylvania ...................................... South Carolina .................................. Texas ................................................. Virginia ............................................... California, Tennessee,
and West Virginia ..............................
20,344 4,231 3,913 5,047
14,176 5,655
10,571
19,029 6,259 4,145 4,897
14,115 5,718
10,854
19,808 4,313 4,163 5,058
14,515 5,571
11,374
18,854 5,552 3,829 5,880
14,024 6,573
10,948
19,275 4,120 4,199 4,670
14,535 6,537
10,631
18,949 3,605 4,244 4,805
14,165 5,575
10,889
Other States .......................................
7,360
7,518
7,831
6,808
7,485
7,296
United States ...................................... Percent of previous year .....................
189,707 101
187,590 101
188,488 101
Source: USDA National Agricultural Statistics Service, Broiler Hatchery, August 7, 2019.
185,278 100
188,814 101
187,299 102
USDA is an equal opportunity provider and employer. All NASS reports are available, at no cost, on the NASS website: http://www.nass.usda.gov