- Collection:
- Georgia Government Publications
- Serial:
- Broiler hatchery news release / United States Department of Agriculture National Agricultural Statistics Service.
- Title:
- Broiler hatchery news release, 2019 August 28
- Creator:
- United States. Department of Agriculture. National Agricultural Statistics Service. Southern Region
- Contributor to Resource:
- Georgia. Department of Agriculture
Florida. Department of Agriculture and Consumer Services
Alabama. Department of Agriculture and Industries
South Carolina. Department of Agriculture - Publisher:
- Athens, Ga. : United States. Department of Agriculture. National Agricultural Statistics Service. Southern Region
- Date of Original:
- 2019-08-28
- Subject:
- Chickens--Hatcheries--Southern States--Statistics--Periodicals
Broilers (Chickens)--Southern States--Statistics--Periodicals
Poultry industry--Southern States--Statistics--Periodicals - Location:
- United States, Georgia, 32.75042, -83.50018
- Medium:
- official reports
tables (documents) - Type:
- Text
- Format:
- application/pdf
- Description:
- This news release contains Georgia agricultural statistics.
- External Identifiers:
- Call Number GA A400.C7 P1 H2 2019/8-28
- Metadata URL:
- https://dlg.galileo.usg.edu/id:dlg_ggpd_i-ga-ba400-pc7-bp1-bh2-b2019-s8-h28-belec-p-btext
- Digital Object URL:
- https://dlg.galileo.usg.edu/do:dlg_ggpd_i-ga-ba400-pc7-bp1-bh2-b2019-s8-h28-belec-p-btext
- Language:
- eng
- Holding Institution:
- University of Georgia. Map and Government Information Library
- Rights:
-

United States Department of Agriculture National Agricultural Statistics Service
Southern Region News Release Broiler Hatchery
Cooperating with the Alabama Department of Agriculture and Industries, Florida Department of Agriculture and Consumer Services, Georgia Department of Agriculture, and South Carolina Department of Agriculture
Southern Regional Field Office 355 East Hancock Avenue, Suite 100 Athens, GA 30601 (706) 713-5400 www.nass.usda.gov
August 28, 2019
Media Contact: Jacqueline Moore
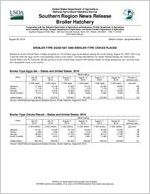
BROILER-TYPE EGGS SET AND BROILER-TYPE CHICKS PLACED
Hatcheries in the United States weekly program set 232 million eggs in incubators during the week ending August 24, 2019. This is up 3 percent from the eggs set the corresponding week a year earlier. Average hatchability for chicks hatched during the week in the United States was 82.8 percent. Broiler growers in the United States placed 189 million chicks for meat production, up 1 percent from the comparable week a year earlier.
Broiler-Type Eggs Set States and United States: 2019
State
July 20, 2019
July 27, 2019
August 3, 2019
Week ending
August 10, 2019
(1,000 eggs)
(1,000 eggs)
(1,000 eggs)
(1,000 eggs)
Alabama ............. Florida ................ Georgia .............. South Carolina....
31,338 1,178
35,114 5,675
32,190 1,178
34,876 5,676
31,835 1,178
34,938 5,698
31,215 1,178
34,681 5,828
United States ......
232,865
233,345
233,684
231,050
Source: USDA National Agricultural Statistics Service, Broiler Hatchery, August 28, 2019.
August 17, 2019
(1,000 eggs)
32,385 1,178
35,110 5,890
233,090
August 24, 2019
(1,000 eggs)
32,650 1,131
35,252 5,822
232,225
Percent of previous year
(percent)
106 92
103 100
103
Broiler-Type Chicks Placed States and United States: 2019
State
July 20, 2019
July 27, 2019
August 3, 2019
Week ending
August 10, 2019
(1,000 chicks) (1,000 chicks) (1,000 chicks) (1,000 chicks)
Alabama ............. Florida ................ Georgia .............. South Carolina....
22,791 1,289
26,644 5,880
23,484 1,303
27,471 4,670
22,746 1,303
27,753 4,843
22,039 1,319
29,887 4,684
United States ......
185,158
188,409
187,529
188,220
Source: USDA National Agricultural Statistics Service, Broiler Hatchery, August 28, 2019.
August 17, 2019
(1,000 chicks)
22,549 1,239
28,410 5,466
188,918
August 24, 2019
(1,000 chicks)
23,205 1,339
27,798 4,924
189,268
Percent of previous year
(percent)
98 98 102 96
101
USDA is an equal opportunity provider and employer. All NASS reports are available, at no cost, on the NASS website: http://www.nass.usda.gov
Broiler-Type Eggs Set Selected States and United States: 2019
State
July 20, 2019
July 27, 2019
Week ending
August 3, 2019
August 10, 2019
(1,000 eggs)
(1,000 eggs)
(1,000 eggs)
(1,000 eggs)
Alabama ............................................. Arkansas ............................................. Delaware ............................................ Florida ................................................ Georgia .............................................. Kentucky ............................................. Louisiana ............................................ Maryland ............................................. Mississippi .......................................... Missouri ..............................................
31,338 24,739
5,366 1,178 35,114 7,756 3,727 8,068 18,276 8,631
32,190 24,775
5,152 1,178 34,876 7,460 3,619 7,866 18,566 8,618
31,835 24,989
5,338 1,178 34,938 7,814 3,713 8,097 18,490 8,614
31,215 24,364
5,175 1,178 34,681 7,874 3,697 7,958 18,490 8,494
North Carolina ..................................... Oklahoma ........................................... Pennsylvania ...................................... South Carolina .................................. Texas .................................................. Virginia ................................................ California, Tennessee,
and West Virginia ..............................
23,982 7,648 5,803 5,675
17,338 6,425
12,244
23,838 7,237 5,669 5,676
17,640 6,425
12,379
23,782 7,618 5,532 5,698
17,558 6,349
11,788
23,942 7,131 5,346 5,828
17,714 6,062
11,762
Other States ........................................
9,557
10,181
10,353
10,139
United States ...................................... Percent of previous year .....................
232,865 101
233,345 102
233,684 102
231,050 102
August 17, 2019
(1,000 eggs)
32,385 24,279
5,338 1,178 35,110 7,749 3,713 7,748 18,348 8,663
23,723 7,335 5,448 5,890
17,422 6,349
12,261
10,151
233,090 103
August 24, 2019
(1,000 eggs)
32,650 24,347
5,367 1,131 35,252 7,606 3,788 7,810 18,152 8,616
23,755 7,687 5,544 5,822
17,117 6,047
11,532
10,002
232,225 103
Broiler-Type Chicks Placed Selected States and United States: 2019
State
July 20, 2019
July 27, 2019
Week ending
August 3, 2019
August 10, 2019
(1,000 chicks) (1,000 chicks) (1,000 chicks) (1,000 chicks)
Alabama ............................................. Arkansas ............................................. Delaware ............................................ Florida ................................................ Georgia .............................................. Kentucky ............................................. Louisiana ............................................ Maryland ............................................. Mississippi .......................................... Missouri ..............................................
22,791 21,846
4,704 1,289 26,644 6,067 2,955 5,164 15,718 5,718
23,484 23,635
4,722 1,303 27,471 6,565 3,213 5,287 16,021 5,834
22,746 23,543
5,967 1,303 27,753 6,860 3,228 5,642 15,421 6,105
22,039 23,640
4,641 1,319 29,887 6,143 3,202 6,205 15,519 6,025
August 17, 2019
(1,000 chicks)
22,549 23,280
4,839 1,239 28,410 6,011 3,138 5,303 15,557 6,590
August 24, 2019
(1,000 chicks)
23,205 22,732
5,604 1,339 27,798 5,864 3,208 5,364 15,480 6,450
North Carolina ..................................... Oklahoma ........................................... Pennsylvania ...................................... South Carolina .................................. Texas .................................................. Virginia ................................................ California, Tennessee,
and West Virginia ..............................
18,868 5,552 3,857 5,880
14,024 6,403
10,881
19,290 4,120 4,142 4,670
14,536 6,380
10,526
18,990 3,605 4,237 4,843
14,183 5,042
10,869
19,004 3,426 4,254 4,684
14,236 5,746
10,703
19,250 3,519 4,192 5,466
14,301 6,306
11,202
19,481 4,559 4,095 4,924
14,588 5,507
10,802
Other States ........................................
6,797
7,210
7,192
7,547
7,766
8,268
United States ...................................... Percent of previous year .....................
185,158 100
188,409 101
187,529 102
Source: USDA National Agricultural Statistics Service, Broiler Hatchery, August 28, 2019.
188,220 101
188,918 102
189,268 101