- Collection:
- Georgia Government Publications
- Serial:
- Broiler hatchery news release / United States Department of Agriculture National Agricultural Statistics Service.
- Title:
- Broiler hatchery news release, 2019 May 15
- Creator:
- United States. Department of Agriculture. National Agricultural Statistics Service. Southern Region
- Contributor to Resource:
- Georgia. Department of Agriculture
Florida. Department of Agriculture and Consumer Services
Alabama. Department of Agriculture and Industries
South Carolina. Department of Agriculture - Publisher:
- Athens, Ga. : United States. Department of Agriculture. National Agricultural Statistics Service. Southern Region
- Date of Original:
- 2019-05-15
- Subject:
- Chickens--Hatcheries--Southern States--Statistics--Periodicals
Broilers (Chickens)--Southern States--Statistics--Periodicals
Poultry industry--Southern States--Statistics--Periodicals - Location:
- United States, Georgia, 32.75042, -83.50018
- Medium:
- official reports
tables (documents) - Type:
- Text
- Format:
- application/pdf
- Description:
- This news release contains Georgia agricultural statistics.
- External Identifiers:
- Call Number GA A400.C7 P1 H2 2019/5-15
- Metadata URL:
- https://dlg.galileo.usg.edu/id:dlg_ggpd_i-ga-ba400-pc7-bp1-bh2-b2019-s5-h15-belec-p-btext
- Digital Object URL:
- https://dlg.galileo.usg.edu/do:dlg_ggpd_i-ga-ba400-pc7-bp1-bh2-b2019-s5-h15-belec-p-btext
- Language:
- eng
- Holding Institution:
- University of Georgia. Map and Government Information Library
- Rights:
-

United States Department of Agriculture National Agricultural Statistics Service
Southern Region News Release Broiler Hatchery
Cooperating with the Alabama Department of Agriculture and Industries, Florida Department of Agriculture and Consumer Services, Georgia Department of Agriculture, and South Carolina Department of Agriculture
Southern Regional Field Office 355 East Hancock Avenue, Suite 100 Athens, GA 30601 (706) 546-2236 www.nass.usda.gov
May 15, 2019
Media Contact: Jacqueline Moore
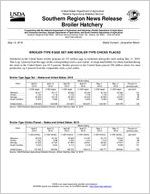
BROILER-TYPE EGGS SET AND BROILER-TYPE CHICKS PLACED
Hatcheries in the United States weekly program set 233 million eggs in incubators during the week ending May 11, 2019. This is up 1 percent from the eggs set the corresponding week a year earlier. Average hatchability for chicks hatched during the week in the United States was 82.5 percent. Broiler growers in the United States placed 190 million chicks for meat production, up 2 percent from the comparable week a year earlier.
Broiler-Type Eggs Set States and United States: 2019
State
Alabama ............. Florida ................ Georgia .............. South Carolina....
April 6, 2019
(1,000 eggs)
30,247 1,194
35,239 5,840
April 13, 2019
(1,000 eggs)
30,117 1,178
35,146 5,980
April 20, 2019
(1,000 eggs)
30,638 1,178
35,499 5,594
Week ending
April 27, 2019
(1,000 eggs)
30,339 1,178
34,942 5,832
United States ......
230,929
233,558
234,854
233,091
Source: USDA National Agricultural Statistics Service, Broiler Hatchery, May 15, 2019.
May 4, 2019
(1,000 eggs)
30,125 1,178
33,950 6,029
232,061
May 11, 2019
(1,000 eggs)
30,362 1,178
34,676 5,892
232,790
Percent of previous year
(percent)
101 96 98
104
100
Broiler-Type Chicks Placed States and United States: 2019
State
April 6, 2019
April 13, 2019
April 20, 2019
Week ending
April 27, 2019
(1,000 chicks) (1,000 chicks) (1,000 chicks) (1,000 chicks)
Alabama ............. Florida ................ Georgia .............. South Carolina....
23,076 1,323
27,252 5,333
22,164 1,298
27,342 5,304
22,699 1,332
27,569 5,112
21,467 1,315
29,061 4,418
United States ......
187,365
185,984
186,705
186,212
Source: USDA National Agricultural Statistics Service, Broiler Hatchery, May 15, 2019.
May 4, 2019
(1,000 chicks)
22,175 1,212
28,594 5,207
188,777
May 11, 2019
(1,000 chicks)
22,842 1,309
27,844 5,508
189,695
Percent of previous year
(percent)
100 86
101 107
102
USDA is an equal opportunity provider and employer. All NASS reports are available, at no cost, on the NASS website: http://www.nass.usda.gov
Broiler-Type Eggs Set Selected States and United States: 2019
State
April 6, 2019
April 13, 2019
Week ending
April 20, 2019
April 27, 2019
(1,000 eggs)
(1,000 eggs)
(1,000 eggs)
(1,000 eggs)
Alabama ............................................ Arkansas ............................................ Delaware ............................................ Florida ............................................... Georgia .............................................. Kentucky ............................................. Louisiana ............................................ Maryland ............................................. Mississippi .......................................... Missouri ..............................................
30,247 25,227
5,368 1,194 35,239 7,787 3,592 7,960 19,183 8,431
30,117 25,194
5,433 1,178 35,146 7,850 3,834 8,349 19,111 8,490
30,638 24,897
5,489 1,178 35,499 7,951 3,848 8,307 19,334 8,585
30,339 24,562
5,303 1,178 34,942 7,849 3,606 8,361 19,081 8,416
North Carolina .................................... Oklahoma ........................................... Pennsylvania ...................................... South Carolina .................................. Texas ................................................. Virginia ............................................... California, Tennessee,
and West Virginia ..............................
22,944 7,346 4,765 5,840
17,374 6,467
12,398
23,718 7,791 5,428 5,980
17,373 6,467
12,156
23,980 7,730 5,649 5,594
17,338 6,469
12,430
23,804 7,992 5,559 5,832
17,706 6,468
12,357
Other States .......................................
9,567
9,943
9,938
9,736
United States ...................................... Percent of previous year .....................
230,929 101
233,558 102
234,854 102
233,091 101
May 4, 2019
(1,000 eggs)
30,125 24,912
5,452 1,178 33,950 7,963 3,818 7,913 18,956 8,296
23,869 7,564 5,619 6,029
17,850 6,318
12,441
9,808
232,061 100
May 11, 2019
(1,000 eggs)
30,362 25,253
5,416 1,178 34,676 7,918 3,788 7,975 19,303 7,967
23,234 7,831 5,615 5,892
17,487 6,440
12,633
9,822
232,790 101
Broiler-Type Chicks Placed Selected States and United States: 2019
State
April 6, 2019
April 13, 2019
Week ending
April 20, 2019
April 27, 2019
(1,000 chicks) (1,000 chicks) (1,000 chicks) (1,000 chicks)
Alabama ............................................ Arkansas ............................................ Delaware ............................................ Florida ............................................... Georgia .............................................. Kentucky ............................................. Louisiana ............................................ Maryland ............................................. Mississippi .......................................... Missouri ..............................................
23,076 21,877
4,919 1,323 27,252 5,370 3,307 6,509 15,214 5,631
22,164 22,754
4,785 1,298 27,342 6,552 3,313 6,030 16,041 5,785
22,699 22,714
5,730 1,332 27,569 6,021 3,220 5,875 16,015 6,679
21,467 22,548
4,645 1,315 29,061 5,879 3,224 6,649 16,106 5,974
May 4, 2019
(1,000 chicks)
22,175 22,052
5,650 1,212 28,594 5,955 3,418 5,484 16,003 5,834
May 11, 2019
(1,000 chicks)
22,842 24,205
5,364 1,309 27,844 6,206 3,450 5,867 16,286 5,781
North Carolina .................................... Oklahoma ........................................... Pennsylvania ...................................... South Carolina .................................. Texas ................................................. Virginia ............................................... California, Tennessee,
and West Virginia ..............................
19,048 4,718 4,012 5,333
14,216 6,205
11,328
19,408 4,083 3,991 5,304
13,991 5,413
10,455
18,625 3,481 3,445 5,112
14,096 5,713
10,664
18,898 4,445 3,373 4,418
14,182 5,486
11,079
19,010 5,538 3,961 5,207
14,141 5,957
10,687
19,143 3,405 4,122 5,508
14,054 5,901
10,588
Other States .......................................
8,027
7,275
7,715
7,463
7,899
7,820
United States ...................................... Percent of previous year .....................
187,365 102
185,984 102
186,705 102
Source: USDA National Agricultural Statistics Service, Broiler Hatchery, May 15, 2019.
186,212 101
188,777 102
189,695 102
USDA is an equal opportunity provider and employer. All NASS reports are available, at no cost, on the NASS website: http://www.nass.usda.gov