- Collection:
- Georgia Government Publications
- Serial:
- Broiler hatchery news release / United States Department of Agriculture National Agricultural Statistics Service.
- Title:
- Broiler hatchery news release, 2019 May 1
- Creator:
- United States. Department of Agriculture. National Agricultural Statistics Service. Southern Region
- Contributor to Resource:
- Georgia. Department of Agriculture
Florida. Department of Agriculture and Consumer Services
Alabama. Department of Agriculture and Industries
South Carolina. Department of Agriculture - Publisher:
- Athens, Ga. : United States. Department of Agriculture. National Agricultural Statistics Service. Southern Region
- Date of Original:
- 2019-05-01
- Subject:
- Chickens--Hatcheries--Southern States--Statistics--Periodicals
Broilers (Chickens)--Southern States--Statistics--Periodicals
Poultry industry--Southern States--Statistics--Periodicals - Location:
- United States, Georgia, 32.75042, -83.50018
- Medium:
- official reports
tables (documents) - Type:
- Text
- Format:
- application/pdf
- Description:
- This news release contains Georgia agricultural statistics.
- External Identifiers:
- Call Number GA A400.C7 P1 H2 2019/5-1
- Metadata URL:
- https://dlg.galileo.usg.edu/id:dlg_ggpd_i-ga-ba400-pc7-bp1-bh2-b2019-s5-h1-belec-p-btext
- Digital Object URL:
- https://dlg.galileo.usg.edu/do:dlg_ggpd_i-ga-ba400-pc7-bp1-bh2-b2019-s5-h1-belec-p-btext
- Language:
- eng
- Holding Institution:
- University of Georgia. Map and Government Information Library
- Rights:
-

United States Department of Agriculture National Agricultural Statistics Service
Southern Region News Release Broiler Hatchery
Cooperating with the Alabama Department of Agriculture and Industries, Florida Department of Agriculture and Consumer Services, Georgia Department of Agriculture, and South Carolina Department of Agriculture
Southern Regional Field Office 355 East Hancock Avenue, Suite 100 Athens, GA 30601 (706) 546-2236 www.nass.usda.gov
May 1, 2019
Media Contact: Jacqueline Moore
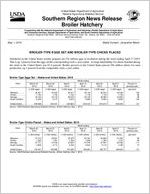
BROILER-TYPE EGGS SET AND BROILER-TYPE CHICKS PLACED
Hatcheries in the United States weekly program set 234 million eggs in incubators during the week ending April 27 2019. This is up 1 percent from the eggs set the corresponding week a year earlier. Average hatchability for chicks hatched during the week in the United States was 82.4 percent. Broiler growers in the United States placed 186 million chicks for meat production, up 1 percent from the comparable week a year earlier.
Broiler-Type Eggs Set States and United States: 2019
State
Alabama ............. Florida ................ Georgia .............. South Carolina....
March 23, 2019
(1,000 eggs)
30,327 1,194
34,100 6,036
March 30, 2019
(1,000 eggs)
30,352 1,194
35,116 5,774
April 6, 2019
(1,000 eggs)
30,247 1,194
35,239 5,840
Week ending
April 13, 2019
(1,000 eggs)
30,146 1,178
35,146 5,980
United States ......
230,588
232,231
230,863
233,440
Source: USDA National Agricultural Statistics Service, Broiler Hatchery, May 1, 2019.
April 20, 2019
(1,000 eggs)
30,543 1,178
35,380 5,594
234,610
April 27, 2019
(1,000 eggs)
30,339 1,178
34,852 5,832
233,525
Percent of previous year
(percent)
100 96 99
102
101
Broiler-Type Chicks Placed States and United States: 2019
State
March 23, 2019
March 30, 2019
April 6, 2019
Week ending
April 13, 2019
(1,000 chicks) (1,000 chicks) (1,000 chicks) (1,000 chicks)
Alabama ............. Florida ................ Georgia .............. South Carolina....
21,313 1,325
27,771 4,909
22,651 1,321
27,040 5,174
23,076 1,323
27,255 5,333
22,164 1,298
27,342 5,304
United States ......
184,007
185,969
187,365
185,984
Source: USDA National Agricultural Statistics Service, Broiler Hatchery, May 1, 2019.
April 20, 2019
(1,000 chicks)
22,699 1,332
27,591 5,112
186,727
April 27, 2019
(1,000 chicks)
21,460 1,315
29,338 4,168
186,222
Percent of previous year
(percent)
95 95 111 74
101
USDA is an equal opportunity provider and employer. All NASS reports are available, at no cost, on the NASS website: http://www.nass.usda.gov
Broiler-Type Eggs Set Selected States and United States: 2019
State
March 23, 2019
March 30, 2019
Week ending
April 6, 2019
April 13, 2019
(1,000 eggs)
(1,000 eggs)
(1,000 eggs)
(1,000 eggs)
Alabama ............................................ Arkansas ............................................ Delaware ............................................ Florida ............................................... Georgia .............................................. Kentucky ............................................. Louisiana ............................................ Maryland ............................................. Mississippi .......................................... Missouri ..............................................
30,327 24,621
4,961 1,194 34,100 7,783 3,682 7,590 18,880 8,549
30,352 24,975
5,490 1,194 35,116 7,912 3,592 8,107 18,896 8,151
30,247 25,222
5,368 1,194 35,239 7,787 3,592 7,960 19,183 8,431
30,146 25,034
5,433 1,178 35,146 7,850 3,834 8,349 19,111 8,490
North Carolina .................................... Oklahoma ........................................... Pennsylvania ...................................... South Carolina .................................. Texas ................................................. Virginia ............................................... California, Tennessee,
and West Virginia ..............................
24,292 7,659 5,325 6,036
17,267 6,459
12,116
23,890 7,790 4,940 5,774
17,430 6,318
12,378
22,944 7,346 4,765 5,840
17,374 6,467
12,398
23,718 7,791 5,428 5,980
17,373 6,467
12,246
Other States .......................................
9,747
9,926
9,506
9,866
United States ...................................... Percent of previous year .....................
230,588 102
232,231 102
230,863 101
233,440 102
April 20, 2019
(1,000 eggs)
30,543 24,867
5,489 1,178 35,380 7,951 3,848 8,307 19,334 8,585
23,980 7,730 5,649 5,594
17,338 6,469
12,430
9,938
234,610 102
April 27, 2019
(1,000 eggs)
30,339 24,469
5,303 1,178 34,852 7,849 3,606 8,361 19,274 8,416
24,006 7,992 5,558 5,832
17,706 6,468
12,357
9,959
233,525 101
Broiler-Type Chicks Placed Selected States and United States: 2019
State
March 23, 2019
March 30, 2019
Week ending
April 6, 2019
April 13, 2019
(1,000 chicks) (1,000 chicks) (1,000 chicks) (1,000 chicks)
Alabama ............................................ Arkansas ............................................ Delaware ............................................ Florida ............................................... Georgia .............................................. Kentucky ............................................. Louisiana ............................................ Maryland ............................................. Mississippi .......................................... Missouri ..............................................
21,313 23,015
5,831 1,325 27,771 6,042 3,290 4,900 13,800 5,522
22,651 23,871
5,101 1,321 27,040 6,160 3,320 5,896 14,359 5,472
23,076 21,877
4,919 1,323 27,252 5,370 3,307 6,509 15,214 5,631
22,164 22,754
4,785 1,298 27,342 6,552 3,313 6,030 16,041 5,785
April 20, 2019
(1,000 chicks)
22,699 22,714
5,730 1,332 27,591 6,021 3,220 5,875 16,015 6,679
April 27, 2019
(1,000 chicks)
21,460 22,833
4,645 1,315 29,338 5,879 3,223 6,649 16,123 5,973
North Carolina .................................... Oklahoma ........................................... Pennsylvania ...................................... South Carolina .................................. Texas ................................................. Virginia ............................................... California, Tennessee,
and West Virginia ..............................
19,248 4,721 4,118 4,909
13,986 5,819
10,882
19,298 3,978 4,034 5,174
13,903 5,866
10,762
19,048 4,718 4,012 5,333
14,216 6,205
11,328
19,408 4,083 3,991 5,304
13,991 5,413
10,455
18,625 3,481 3,445 5,112
14,096 5,713
10,664
18,883 4,222 3,369 4,168
14,157 5,487
11,079
Other States .......................................
7,515
7,763
8,027
7,275
7,715
7,419
United States ...................................... Percent of previous year .....................
184,007 100
185,969 102
187,365 102
Source: USDA National Agricultural Statistics Service, Broiler Hatchery, May 1, 2019.
185,984 102
186,727 102
186,222 101
USDA is an equal opportunity provider and employer. All NASS reports are available, at no cost, on the NASS website: http://www.nass.usda.gov