- Collection:
- Georgia Government Publications
- Serial:
- Broiler hatchery news release / United States Department of Agriculture National Agricultural Statistics Service.
- Title:
- Broiler hatchery news release, 2019 April 10
- Creator:
- United States. Department of Agriculture. National Agricultural Statistics Service. Southern Region
- Contributor to Resource:
- Georgia. Department of Agriculture
Florida. Department of Agriculture and Consumer Services
Alabama. Department of Agriculture and Industries
South Carolina. Department of Agriculture - Publisher:
- Athens, Ga. : United States. Department of Agriculture. National Agricultural Statistics Service. Southern Region
- Date of Original:
- 2019-04-10
- Subject:
- Chickens--Hatcheries--Southern States--Statistics--Periodicals
Broilers (Chickens)--Southern States--Statistics--Periodicals
Poultry industry--Southern States--Statistics--Periodicals - Location:
- United States, Georgia, 32.75042, -83.50018
- Medium:
- official reports
tables (documents) - Type:
- Text
- Format:
- application/pdf
- Description:
- This news release contains Georgia agricultural statistics.
- External Identifiers:
- Call Number GA A400.C7 P1 H2 2019/4-10
- Metadata URL:
- https://dlg.galileo.usg.edu/id:dlg_ggpd_i-ga-ba400-pc7-bp1-bh2-b2019-s4-h10-belec-p-btext
- Digital Object URL:
- https://dlg.galileo.usg.edu/do:dlg_ggpd_i-ga-ba400-pc7-bp1-bh2-b2019-s4-h10-belec-p-btext
- Language:
- eng
- Holding Institution:
- University of Georgia. Map and Government Information Library
- Rights:
-

United States Department of Agriculture National Agricultural Statistics Service
Southern Region News Release Broiler Hatchery
Cooperating with the Alabama Department of Agriculture and Industries, Florida Department of Agriculture and Consumer Services, Georgia Department of Agriculture, and South Carolina Department of Agriculture
Southern Regional Field Office 355 East Hancock Avenue, Suite 100 Athens, GA 30601 (706) 546-2236 www.nass.usda.gov
April 10, 2019
Media Contact: Jacqueline Moore
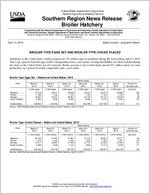
BROILER-TYPE EGGS SET AND BROILER-TYPE CHICKS PLACED
Hatcheries in the United States weekly program set 231 million eggs in incubators during the week ending April 6, 2019. This is up 1 percent from the eggs set the corresponding week a year earlier. Average hatchability for chicks hatched during the week in the United States was 82.3 percent. Broiler growers in the United States placed 187 million chicks for meat production, up 2 percent from the comparable week a year earlier.
Broiler-Type Eggs Set States and United States: 2019
State
Alabama ............. Florida ................ Georgia .............. South Carolina....
March 2, 2019
(1,000 eggs)
31,678 1,225
34,627 5,832
March 9, 2019
(1,000 eggs)
29,911 1,194
35,077 5,936
March 16, 2019
(1,000 eggs)
30,006 1,194
35,021 5,926
Week ending
March 23, 2019
(1,000 eggs)
30,327 1,194
34,100 6,036
United States ......
230,822
231,655
232,096
230,785
Source: USDA National Agricultural Statistics Service, Broiler Hatchery, April 10, 2019.
March 30, 2019
(1,000 eggs)
30,476 1,194
35,116 5,774
231,790
April 6, 2019
(1,000 eggs)
29,862 1,194
35,239 5,840
231,144
Percent of previous year
(percent)
100 97 99
104
101
Broiler-Type Chicks Placed States and United States: 2019
State
March 2, 2019
March 9, 2019
March 16, 2019
Week ending
March 23, 2019
(1,000 chicks) (1,000 chicks) (1,000 chicks) (1,000 chicks)
Alabama ............. Florida ................ Georgia .............. South Carolina....
22,190 1,342
27,917 5,265
21,097 1,334
28,857 4,206
21,851 1,230
27,458 4,191
21,313 1,324
27,773 4,909
United States ......
183,462
184,218
185,760
183,563
Source: USDA National Agricultural Statistics Service, Broiler Hatchery, April 10, 2019.
March 30, 2019
(1,000 chicks)
22,651 1,320
27,036 5,174
185,097
April 6, 2019
(1,000 chicks)
23,071 1,321
27,236 5,333
186,776
Percent of previous year
(percent)
96 104 104 111
102
USDA is an equal opportunity provider and employer. All NASS reports are available, at no cost, on the NASS website: http://www.nass.usda.gov
Broiler-Type Eggs Set Selected States and United States: 2019
State
March 2, 2019
March 9, 2019
Week ending
March 16, 2019
March 23, 2019
(1,000 eggs)
(1,000 eggs)
(1,000 eggs)
(1,000 eggs)
Alabama ............................................ Arkansas ............................................ Delaware ............................................ Florida ............................................... Georgia .............................................. Kentucky ............................................. Louisiana ............................................ Maryland ............................................. Mississippi .......................................... Missouri ..............................................
31,678 24,898
5,127 1,225 34,627 7,760 3,803 8,204 16,719 8,421
29,911 24,522
5,326 1,194 35,077 7,621 3,803 8,036 18,089 8,717
30,006 24,410
5,489 1,194 35,021 7,791 3,773 8,326 17,951 8,151
30,327 24,621
5,490 1,194 34,100 7,783 3,682 7,590 18,880 8,549
North Carolina .................................... Oklahoma ........................................... Pennsylvania ...................................... South Carolina .................................. Texas ................................................. Virginia ............................................... California, Tennessee,
and West Virginia ..............................
24,092 7,505 5,167 5,832
17,249 6,621
12,147
24,153 7,585 5,215 5,936
17,359 6,469
12,811
24,260 7,885 5,264 5,926
17,405 6,394
12,699
24,253 7,643 5,025 6,036
17,267 6,459
12,120
Other States .......................................
9,747
9,831
10,151
9,766
United States ...................................... Percent of previous year .....................
230,822 101
231,655 102
232,096 102
230,785 102
March 30, 2019
(1,000 eggs)
30,476 24,875
5,490 1,194 35,116 7,912 3,652 7,584 18,896 8,151
24,173 7,696 4,664 5,774
17,430 6,318
12,463
9,926
231,790 102
April 6, 2019
(1,000 eggs)
29,862 25,122
5,384 1,194 35,239 7,787 3,652 7,960 19,183 8,431
23,826 7,252 4,667 5,840
17,374 6,467
12,398
9,506
231,144 101
Broiler-Type Chicks Placed Selected States and United States: 2019
State
March 2, 2019
March 9, 2019
Week ending
March 16, 2019
March 23, 2019
(1,000 chicks) (1,000 chicks) (1,000 chicks) (1,000 chicks)
Alabama ............................................ Arkansas ............................................ Delaware ............................................ Florida ............................................... Georgia .............................................. Kentucky ............................................. Louisiana ............................................ Maryland ............................................. Mississippi .......................................... Missouri ..............................................
22,190 24,162
5,061 1,342 27,917 5,788 3,234 6,005 15,577 4,789
21,097 22,522
5,204 1,334 28,857 6,836 3,275 5,612 15,814 6,140
21,851 22,721
6,034 1,230 27,458 6,217 3,293 5,604 15,969 6,503
21,313 23,122
5,642 1,324 27,773 6,041 3,290 5,334 13,800 5,522
March 30, 2019
(1,000 chicks)
22,651 23,794
5,414 1,320 27,036 6,160 3,320 5,696 14,359 5,472
April 6, 2019
(1,000 chicks)
23,071 21,738
5,203 1,321 27,236 5,370 3,307 6,377 15,260 5,631
North Carolina .................................... Oklahoma ........................................... Pennsylvania ...................................... South Carolina .................................. Texas ................................................. Virginia ............................................... California, Tennessee,
and West Virginia ..............................
17,551 3,260 3,810 5,265
13,649 5,935
10,172
18,720 3,728 3,858 4,206
13,875 5,603
9,832
19,693 3,552 3,907 4,191
13,812 5,250
11,186
19,130 4,566 3,868 4,909
13,862 5,669
10,876
18,912 3,988 3,853 5,174
13,779 5,619
10,776
18,939 4,983 3,847 5,333
14,193 5,626
11,321
Other States .......................................
7,755
7,705
7,289
7,522
7,774
8,020
United States ...................................... Percent of previous year .....................
183,462 101
184,218 101
185,760 102
Source: USDA National Agricultural Statistics Service, Broiler Hatchery, April 10, 2019.
183,563 100
185,097 101
186,776 102
USDA is an equal opportunity provider and employer. All NASS reports are available, at no cost, on the NASS website: http://www.nass.usda.gov