- Collection:
- Georgia Government Publications
- Serial:
- Broiler hatchery news release / United States Department of Agriculture National Agricultural Statistics Service.
- Title:
- Broiler hatchery news release, 2019 March 27
- Creator:
- United States. Department of Agriculture. National Agricultural Statistics Service. Southern Region
- Contributor to Resource:
- Georgia. Department of Agriculture
Florida. Department of Agriculture and Consumer Services
Alabama. Department of Agriculture and Industries
South Carolina. Department of Agriculture - Publisher:
- Athens, Ga. : United States. Department of Agriculture. National Agricultural Statistics Service. Southern Region
- Date of Original:
- 2019-03-27
- Subject:
- Chickens--Hatcheries--Southern States--Statistics--Periodicals
Broilers (Chickens)--Southern States--Statistics--Periodicals
Poultry industry--Southern States--Statistics--Periodicals - Location:
- United States, Georgia, 32.75042, -83.50018
- Medium:
- official reports
tables (documents) - Type:
- Text
- Format:
- application/pdf
- Description:
- This news release contains Georgia agricultural statistics.
- External Identifiers:
- Call Number GA A400.C7 P1 H2 2019/3-27
- Metadata URL:
- https://dlg.galileo.usg.edu/id:dlg_ggpd_i-ga-ba400-pc7-bp1-bh2-b2019-s3-h27-belec-p-btext
- Digital Object URL:
- https://dlg.galileo.usg.edu/do:dlg_ggpd_i-ga-ba400-pc7-bp1-bh2-b2019-s3-h27-belec-p-btext
- Language:
- eng
- Holding Institution:
- University of Georgia. Map and Government Information Library
- Rights:
-

United States Department of Agriculture National Agricultural Statistics Service
Southern Region News Release Broiler Hatchery
Cooperating with the Alabama Department of Agriculture and Industries, Florida Department of Agriculture and Consumer Services, Georgia Department of Agriculture, and South Carolina Department of Agriculture
Southern Regional Field Office 355 East Hancock Avenue, Suite 100 Athens, GA 30601 (706) 546-2236 www.nass.usda.gov
March 27, 2019
Media Contact: Jacqueline Moore
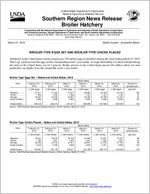
BROILER-TYPE EGGS SET AND BROILER-TYPE CHICKS PLACED
Hatcheries in the United States weekly program set 230 million eggs in incubators during the week ending March 23, 2019. This is up 2 percent from the eggs set the corresponding week a year earlier. Average hatchability for chicks hatched during the week in the United States was 81.2 percent. Broiler growers in the United States placed 184 million chicks for meat production, up slightly from the comparable week a year earlier.
Broiler-Type Eggs Set States and United States: 2019
State
Alabama ............. Florida ................ Georgia .............. South Carolina....
February 16, 2019
(1,000 eggs)
31,611 1,225
34,607 5,690
February 23, 2019
(1,000 eggs)
31,383 1,225
34,406 5,906
March 2, 2019
(1,000 eggs)
31,677 1,225
34,627 5,832
Week ending
March 9, 2019
(1,000 eggs)
29,980 1,194
34,760 5,936
United States ......
230,449
232,516
231,371
232,089
Source: USDA National Agricultural Statistics Service, Broiler Hatchery, March 27, 2019.
March 16, 2019
(1,000 eggs)
30,138 1,194
34,788 5,926
231,389
March 23, 2019
(1,000 eggs)
30,152 1,194
34,100 6,036
230,420
Percent of previous year
(percent)
100 97 97
103
102
Broiler-Type Chicks Placed States and United States: 2019
State
February 16, 2019
February 23, 2019
March 2, 2019
Week ending
March 9, 2019
(1,000 chicks) (1,000 chicks) (1,000 chicks) (1,000 chicks)
Alabama ............. Florida ................ Georgia .............. South Carolina....
23,481 1,303
26,798 5,433
22,978 1,221
27,515 5,189
22,190 1,342
27,917 5,265
21,098 1,334
28,857 4,206
United States ......
183,591
184,178
183,511
184,198
Source: USDA National Agricultural Statistics Service, Broiler Hatchery, March 27, 2019.
March 16, 2019
(1,000 chicks)
21,851 1,230
27,458 4,191
185,719
March 23, 2019
(1,000 chicks)
21,307 1,324
27,759 4,909
184,038
Percent of previous year
(percent)
96 97 99 100
100
USDA is an equal opportunity provider and employer. All NASS reports are available, at no cost, on the NASS website: http://www.nass.usda.gov
Broiler-Type Eggs Set Selected States and United States: 2019
State
February 16, 2019
February 23, 2019
Week ending
March 2, 2019
March 9, 2019
(1,000 eggs)
(1,000 eggs)
(1,000 eggs)
(1,000 eggs)
Alabama ............................................ Arkansas ............................................ Delaware ............................................ Florida ............................................... Georgia .............................................. Kentucky ............................................. Louisiana ............................................ Maryland ............................................. Mississippi .......................................... Missouri ..............................................
31,611 24,776
5,225 1,225 34,607 7,675 3,803 7,896 18,498 8,381
31,383 25,004
5,342 1,225 34,406 7,803 3,803 8,253 18,655 8,478
31,677 24,898
5,127 1,225 34,627 7,760 3,803 8,204 16,719 8,421
29,980 25,181
5,326 1,194 34,760 7,621 3,803 8,036 18,290 8,717
North Carolina .................................... Oklahoma ........................................... Pennsylvania ...................................... South Carolina .................................. Texas ................................................. Virginia ............................................... California, Tennessee,
and West Virginia ..............................
23,780 7,549 5,174 5,690
16,992 6,312
11,462
23,252 7,683 5,220 5,906
17,256 6,489
12,693
24,136 7,505 5,167 5,832
17,249 6,621
12,653
24,226 7,585 5,167 5,936
17,359 6,469
12,608
Other States .......................................
9,793
9,665
9,747
9,831
United States ...................................... Percent of previous year .....................
230,449 101
232,516 102
231,371 101
232,089 102
March 16, 2019
(1,000 eggs)
30,138 24,410
5,297 1,194 34,788 7,791 3,773 8,295 17,951 8,151
24,333 7,885 5,138 5,926
17,405 6,394
12,299
10,221
231,389 101
March 23, 2019
(1,000 eggs)
30,152 24,621
5,263 1,194 34,100 7,783 3,682 7,572 18,880 8,549
24,330 7,643 5,084 6,036
17,207 6,459
12,059
9,806
230,420 102
Broiler-Type Chicks Placed Selected States and United States: 2019
State
February 16, 2019
February 23, 2019
Week ending
March 2, 2019
March 9, 2019
(1,000 chicks) (1,000 chicks) (1,000 chicks) (1,000 chicks)
Alabama ............................................ Arkansas ............................................ Delaware ............................................ Florida ............................................... Georgia .............................................. Kentucky ............................................. Louisiana ............................................ Maryland ............................................. Mississippi .......................................... Missouri ..............................................
23,481 20,899
5,692 1,303 26,798 6,060 3,167 5,544 15,380 6,155
22,978 20,982
5,477 1,221 27,515 6,209 3,222 5,850 15,521 6,069
22,190 24,162
5,061 1,342 27,917 5,788 3,234 6,005 15,577 4,789
21,098 22,522
5,204 1,334 28,857 6,836 3,275 5,612 15,814 6,140
March 16, 2019
(1,000 chicks)
21,851 22,721
5,500 1,230 27,458 6,217 3,293 6,145 15,969 6,503
March 23, 2019
(1,000 chicks)
21,307 23,122
5,426 1,324 27,759 6,041 3,286 5,582 13,806 5,522
North Carolina .................................... Oklahoma ........................................... Pennsylvania ...................................... South Carolina .................................. Texas ................................................. Virginia ............................................... California, Tennessee,
and West Virginia ..............................
17,729 5,002 3,951 5,433
13,118 6,096
10,462
18,746 4,653 3,909 5,189
13,653 5,615
9,990
17,583 3,260 3,810 5,265
13,649 5,935
10,189
18,709 3,728 3,839 4,206
13,875 5,603
9,915
19,657 3,552 3,810 4,191
13,812 5,302
11,211
19,143 4,566 3,853 4,909
13,846 5,680
11,344
Other States .......................................
7,321
7,379
7,755
7,631
7,297
7,522
United States ...................................... Percent of previous year .....................
183,591 102
184,178 102
183,511 101
Source: USDA National Agricultural Statistics Service, Broiler Hatchery, March 27, 2019.
184,198 101
185,719 102
184,038 100
USDA is an equal opportunity provider and employer. All NASS reports are available, at no cost, on the NASS website: http://www.nass.usda.gov