- Collection:
- Georgia Government Publications
- Serial:
- Broiler hatchery news release / United States Department of Agriculture National Agricultural Statistics Service.
- Title:
- Broiler hatchery news release, 2019 November 13
- Creator:
- United States. Department of Agriculture. National Agricultural Statistics Service. Southern Region
- Contributor to Resource:
- Georgia. Department of Agriculture
Florida. Department of Agriculture and Consumer Services
Alabama. Department of Agriculture and Industries
South Carolina. Department of Agriculture - Publisher:
- Athens, Ga. : United States. Department of Agriculture. National Agricultural Statistics Service. Southern Region
- Date of Original:
- 2019-11-13
- Subject:
- Chickens--Hatcheries--Southern States--Statistics--Periodicals
Broilers (Chickens)--Southern States--Statistics--Periodicals
Poultry industry--Southern States--Statistics--Periodicals - Location:
- United States, Georgia, 32.75042, -83.50018
- Medium:
- official reports
tables (documents) - Type:
- Text
- Format:
- application/pdf
- Description:
- This news release contains Georgia agricultural statistics.
- External Identifiers:
- Call Number GA A400.C7 P1 H2 2019/11-13
- Metadata URL:
- https://dlg.galileo.usg.edu/id:dlg_ggpd_i-ga-ba400-pc7-bp1-bh2-b2019-s11-h13-belec-p-btext
- Digital Object URL:
- https://dlg.galileo.usg.edu/do:dlg_ggpd_i-ga-ba400-pc7-bp1-bh2-b2019-s11-h13-belec-p-btext
- Language:
- eng
- Holding Institution:
- University of Georgia. Map and Government Information Library
- Rights:
-

United States Department of Agriculture National Agricultural Statistics Service
Southern Region News Release Broiler Hatchery
Cooperating with the Alabama Department of Agriculture and Industries, Florida Department of Agriculture and Consumer Services, Georgia Department of Agriculture, and South Carolina Department of Agriculture
Southern Regional Field Office 355 East Hancock Avenue, Suite 100 Athens, GA 30601 (706) 713-5400 www.nass.usda.gov
November 13, 2019
Media Contact: Jacqueline Moore
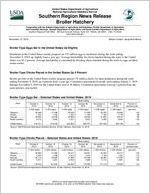
Broiler-Type Eggs Set in the United States Up Slightly
Hatcheries in the United States weekly program set 222 million eggs in incubators during the week ending November 9, 2019, up slightly from a year ago. Average hatchability for chicks hatched during the week in the United States was 82.2 percent. Average hatchability is calculated by dividing chicks hatched during the week by eggs set three weeks earlier.
Broiler-Type Chicks Placed in the United States Up 4 Percent
Broiler growers in the United States weekly program placed 179 million chicks for meat production during the week ending November 9, 2019, up 4 percent from a year ago. Cumulative placements from the week ending January 5, 2019 through November 9, 2019 for the United States were 8.36 billion. Cumulative placements were up 2 percent from the same period a year earlier.
Broiler-Type Eggs Set Selected States and United States: 2019
State
October 5, 2019
October 12, 2019
October 19, 2019
Week ending
October 26, 2019
(1,000 eggs)
(1,000 eggs)
(1,000 eggs)
(1,000 eggs)
Alabama ............. Florida ................ Georgia .............. South Carolina....
30,098 1,163
33,655 5,516
31,598 1,163
33,326 5,505
30,538 1,163
33,859 5,727
31,308 1,163
33,255 5,857
November 2, 2019
(1,000 eggs)
30,782 1,163
31,930 5,390
United States ......
219,151
219,439
223,363
226,791
Source: USDA National Agricultural Statistics Service, Broiler Hatchery, November 13, 2019.
224,462
November 9, 2019
(1,000 eggs)
30,956 1,178
33,012 5,620
222,196
Percent of previous year
(percent)
103 99 99
100
100
Broiler-Type Chicks Placed Selected States and United States: 2019
State
October 5, 2019
October 12, 2019
October 19, 2019
Week ending
October 26, 2019
November 2, 2019
(1,000 chicks) (1,000 chicks) (1,000 chicks) (1,000 chicks) (1,000 chicks)
Alabama ............. Florida ................ Georgia .............. South Carolina....
22,662 1,255
28,115 4,971
21,680 1,286
28,389 4,521
23,447 1,313
27,366 5,049
23,561 1,270
25,489 4,268
23,392 1,196
26,384 5,116
United States ......
179,049
181,694
182,522
176,366
Source: USDA National Agricultural Statistics Service, Broiler Hatchery, November 13, 2019.
177,419
November 9, 2019
(1,000 chicks)
22,213 1,281
27,395 4,881
178,905
Percent of previous year
(percent)
103 173 107 109
104
USDA is an equal opportunity provider and employer. All NASS reports are available, at no cost, on the NASS website: http://www.nass.usda.gov
Broiler-Type Eggs Set Selected States and United States: 2019
State
October 5, 2019
October 12, 2019
Week ending
October 19, 2019
October 26, 2019
(1,000 eggs)
(1,000 eggs)
(1,000 eggs)
(1,000 eggs)
Alabama ............................................. Arkansas ............................................. Delaware ............................................ Florida ................................................. Georgia ............................................... Kentucky ............................................. Louisiana ............................................ Maryland ............................................. Mississippi .......................................... Missouri ..............................................
30,098 22,557
5,034 1,163 33,655 7,199 3,295 7,867 14,838 8,387
31,598 20,913
4,872 1,163 33,326 7,523 3,677 7,102 16,385 8,288
30,538 21,470
5,152 1,163 33,859 7,326 3,879 7,592 17,742 8,332
31,308 22,809
5,274 1,163 33,255 7,882 3,864 7,286 17,530 8,136
North Carolina ..................................... Oklahoma ........................................... Pennsylvania ...................................... South Carolina .................................... Texas .................................................. Virginia ................................................ California, Tennessee,
and West Virginia ..............................
22,396 7,760 5,820 5,516
16,049 5,635
12,525
22,589 6,224 5,760 5,505
16,183 6,408
11,967
23,908 6,433 5,719 5,727
16,944 6,498
11,154
23,500 7,782 4,944 5,857
17,356 6,454
12,416
Other States ........................................
9,357
9,956
9,927
9,975
United States ...................................... Percent of previous year .....................
219,151 101
219,439 101
223,363 104
Source: USDA National Agricultural Statistics Service, Broiler Hatchery, November 13, 2019.
226,791 104
November 2, 2019
(1,000 eggs)
30,782 22,872
5,023 1,163 31,930 7,980 3,334 7,877 17,196 8,104
23,851 7,714 5,580 5,390
17,114 5,990
12,730
9,832
224,462 104
November 9, 2019
(1,000 eggs)
30,956 22,448
4,960 1,178 33,012 6,892 3,607 8,014 17,546 7,751
23,594 7,393 5,786 5,620
15,658 6,302
11,160
10,319
222,196 100
Broiler-Type Chicks Placed Selected States and United States: 2019
State
October 5, 2019
October 12, 2019
Week ending
October 19, 2019
October 26, 2019
(1,000 chicks) (1,000 chicks) (1,000 chicks) (1,000 chicks)
Alabama ............................................. Arkansas ............................................. Delaware ............................................ Florida ................................................. Georgia ............................................... Kentucky ............................................. Louisiana ............................................ Maryland ............................................. Mississippi .......................................... Missouri ..............................................
22,662 18,232
4,198 1,255 28,115 5,728 3,208 5,786 14,563 5,682
21,680 21,487
5,370 1,286 28,389 5,406 3,078 5,093 14,626 6,274
23,447 22,902
6,240 1,313 27,366 5,912 3,367 4,394 14,289 6,227
23,561 21,444
5,237 1,270 25,489 6,165 2,804 5,259 12,564 5,731
November 2, 2019
(1,000 chicks)
23,392 19,661
4,069 1,196 26,384 6,307 3,192 5,745 13,621 5,621
November 9, 2019
(1,000 chicks)
22,213 18,846
4,836 1,281 27,395 5,846 3,286 5,085 14,885 5,431
North Carolina ..................................... Oklahoma ........................................... Pennsylvania ...................................... South Carolina .................................... Texas .................................................. Virginia ................................................ California, Tennessee,
and West Virginia ..............................
19,126 4,407 3,998 4,971
12,939 5,935
10,794
19,212 3,366 4,194 4,521
13,877 5,616
9,719
19,084 2,789 3,667 5,049
13,541 5,585
9,926
18,282 3,870 4,326 4,268
13,464 4,929
10,429
18,399 3,248 4,208 5,116
13,477 5,801
10,414
18,934 4,246 4,152 4,881
13,418 6,200
10,419
Other States ........................................
7,450
8,500
7,424
7,274
7,568
7,551
United States ...................................... Percent of previous year .....................
179,049 105
181,694 102
182,522 106
Source: USDA National Agricultural Statistics Service, Broiler Hatchery, November 13, 2019.
176,366 101
177,419 102
178,905 104