- Collection:
- Georgia Government Publications
- Serial:
- Broiler hatchery news release / United States Department of Agriculture National Agricultural Statistics Service.
- Title:
- Broiler hatchery news release, 2019 October 2
- Creator:
- United States. Department of Agriculture. National Agricultural Statistics Service. Southern Region
- Contributor to Resource:
- Georgia. Department of Agriculture; Florida. Department of Agriculture and Consumer Services; Alabama. Department of Agriculture and Industries; South Carolina. Department of Agriculture
- Publisher:
- Athens, Ga. : United States. Department of Agriculture. National Agricultural Statistics Service. Southern Region
- Date of Original:
- 2019-10-02
- Subject:
- Chickens--Hatcheries--Southern States--Statistics--Periodicals
Broilers (Chickens)--Southern States--Statistics--Periodicals
Poultry industry--Southern States--Statistics--Periodicals - Location:
- United States, Georgia, 32.75042, -83.50018
- Medium:
- official reports
tables (documents) - Type:
- Text
- Format:
- application/pdf
- Description:
- This news release contains Georgia agricultural statistics.
- External Identifiers:
- Call Number GA A400.C7 P1 H2 2019/10-2
- Metadata URL:
- https://dlg.galileo.usg.edu/id:dlg_ggpd_i-ga-ba400-pc7-bp1-bh2-b2019-s10-h2-belec-p-btext
- Digital Object URL:
- https://dlg.galileo.usg.edu/do:dlg_ggpd_i-ga-ba400-pc7-bp1-bh2-b2019-s10-h2-belec-p-btext
- Language:
- eng
- Holding Institution:
- University of Georgia. Map and Government Information Library
- Rights:
-

United States Department of Agriculture National Agricultural Statistics Service
Southern Region News Release Broiler Hatchery
Cooperating with the Alabama Department of Agriculture and Industries, Florida Department of Agriculture and Consumer Services, Georgia Department of Agriculture, and South Carolina Department of Agriculture
Southern Regional Field Office 355 East Hancock Avenue, Suite 100 Athens, GA 30601 (706) 713-5400 www.nass.usda.gov
October 2, 2019
Media Contact: Jacqueline Moore
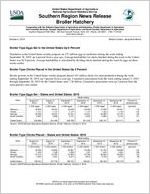
Broiler-Type Eggs Set in the United States Up 6 Percent
Hatcheries in the United States weekly program set 227 million eggs in incubators during the week ending September 28, 2019, up 6 percent from a year ago. Average hatchability for chicks hatched during the week in the United States was 82.9 percent. Average hatchability is calculated by dividing chicks hatched during the week by eggs set three weeks earlier.
Broiler-Type Chicks Placed in the United States Up 5 Percent
Broiler growers in the United States weekly program placed 183 million chicks for meat production during the week ending September 28, 2019, up 5 percent from a year ago. Cumulative placements from the week ending January 5, 2019 through September 28, 2019 for the United States were 7.28 billion. Cumulative placements were up 2 percent from the same period a year earlier.
Broiler-Type Eggs Set States and United States: 2019
State
August 24, 2019
August 31, 2019
September 7, 2019
Week ending
September 14, 2019
(1,000 eggs)
(1,000 eggs)
(1,000 eggs)
(1,000 eggs)
Alabama ............. Florida ................ Georgia .............. South Carolina....
32,650 1,131
35,258 5,822
32,924 1,147
35,207 5,828
32,638 1,147
34,724 5,737
32,208 1,147
34,621 5,535
September 21, 2019
(1,000 eggs)
31,506 1,163
33,985 5,965
September 28, 2019
(1,000 eggs)
32,091 1,178
34,778 5,740
United States ......
230,866
231,089
225,798
221,246
Source: USDA National Agricultural Statistics Service, Broiler Hatchery, October 2, 2019.
226,197
227,471
Percent of previous year
(percent)
116 107 105 101
106
Broiler-Type Chicks Placed States and United States: 2019
State
August 24, 2019
August 31, 2019
September 7, 2019
Week ending
September 14, 2019
(1,000 chicks) (1,000 chicks) (1,000 chicks) (1,000 chicks)
Alabama ............. Florida ................ Georgia .............. South Carolina....
23,228 1,340
27,913 4,923
23,852 1,335
27,267 5,327
23,897 1,298
27,693 5,244
24,080 1,167
27,530 5,615
September 21, 2019
(1,000 chicks)
24,702 1,249
26,650 5,732
September 28, 2019
(1,000 chicks)
23,508 1,254
28,329 4,573
United States ......
189,404
187,730
188,194
186,081
Source: USDA National Agricultural Statistics Service, Broiler Hatchery, October 2, 2019.
186,463
182,749
Percent of previous year
(percent)
104 199 103
96
105
USDA is an equal opportunity provider and employer. All NASS reports are available, at no cost, on the NASS website: http://www.nass.usda.gov
Broiler-Type Eggs Set Selected States and United States: 2019
State
August 24, 2019
August 31, 2019
Week ending
September 7, September 14,
2019
2019
(1,000 eggs)
(1,000 eggs)
(1,000 eggs)
(1,000 eggs)
Alabama ............................................. Arkansas ............................................. Delaware ............................................ Florida ................................................. Georgia ............................................... Kentucky ............................................. Louisiana ............................................ Maryland ............................................. Mississippi .......................................... Missouri ..............................................
32,650 24,347
5,337 1,131 35,258 7,606 3,788 7,810 18,152 8,616
32,924 24,216
5,245 1,147 35,207 7,850 3,682 7,435 17,653 8,679
32,638 23,476
5,058 1,147 34,724 7,443 3,743 7,377 17,500 8,629
32,208 19,684
4,778 1,147 34,621 7,314 3,688 7,245 17,191 8,497
September 21, 2019
(1,000 eggs)
31,506 23,392
4,778 1,163 33,985 7,208 3,577 7,990 17,621 8,063
September 28, 2019
(1,000 eggs)
32,091 24,267
4,778 1,178 34,778 7,359 3,879 7,869 17,289 7,654
North Carolina ..................................... Oklahoma ........................................... Pennsylvania ...................................... South Carolina .................................... Texas .................................................. Virginia ................................................ California, Tennessee,
and West Virginia ..............................
23,748 7,687 5,088 5,822
17,117 6,047
10,875
23,855 7,724 5,500 5,828
16,759 6,213
11,024
22,102 7,742 5,209 5,737
16,240 6,174
10,946
23,154 6,658 5,459 5,535
16,876 6,349
11,048
23,013 7,394 5,441 5,965
17,473 6,349
11,104
23,357 7,610 5,066 5,740
16,573 6,160
12,407
Other States ........................................
9,787
10,148
9,913
9,794
10,175
9,416
United States ...................................... Percent of previous year .....................
230,866 103
231,089 105
225,798 104
Source: USDA National Agricultural Statistics Service, Broiler Hatchery, October 2, 2019.
221,246 104
226,197 102
227,471 106
Broiler-Type Chicks Placed Selected States and United States: 2019
State
August 24, 2019
August 31, 2019
Week ending
September 7, September 14,
2019
2019
(1,000 chicks) (1,000 chicks) (1,000 chicks) (1,000 chicks)
Alabama ............................................. Arkansas ............................................. Delaware ............................................ Florida ................................................. Georgia ............................................... Kentucky ............................................. Louisiana ............................................ Maryland ............................................. Mississippi .......................................... Missouri ..............................................
23,228 22,555
5,453 1,340 27,913 5,865 3,208 5,592 15,480 6,450
23,852 20,245
5,270 1,335 27,267 6,172 3,452 5,497 15,388 6,686
23,897 22,655
5,432 1,298 27,693 6,161 3,198 5,777 15,340 6,266
24,080 21,519
5,272 1,167 27,530 6,417 3,236 5,537 15,134 5,785
September 21, 2019
(1,000 chicks)
24,702 21,856
4,558 1,249 26,650 6,456 3,178 6,251 14,742 6,101
September 28, 2019
(1,000 chicks)
23,508 21,937
4,586 1,254 28,329 5,686 3,240 5,537 14,912 5,839
North Carolina ..................................... Oklahoma ........................................... Pennsylvania ...................................... South Carolina .................................... Texas .................................................. Virginia ................................................ California, Tennessee,
and West Virginia ..............................
19,532 4,596 4,174 4,923
14,585 5,423
10,857
19,147 5,673 4,156 5,327
14,290 5,811
10,431
19,344 3,935 3,957 5,244
14,394 5,338
10,502
19,076 5,469 3,816 5,615
14,191 5,249
9,736
19,315 4,921 4,100 5,732
13,921 5,231
9,901
18,141 4,561 3,885 4,573
13,439 5,734
9,815
Other States ........................................
8,230
7,731
7,763
7,252
7,599
7,773
United States ...................................... Percent of previous year .....................
189,404 101
187,730 102
188,194 103
Source: USDA National Agricultural Statistics Service, Broiler Hatchery, October 2, 2019.
186,081 103
186,463 105
182,749 105