- Collection:
- Georgia Government Publications
- Serial:
- Broiler hatchery news release / United States Department of Agriculture National Agricultural Statistics Service.
- Title:
- Broiler hatchery news release, 2018 September 6
- Contributor to Resource:
- Georgia. Department of Agriculture
Florida. Department of Agriculture and Consumer Services
Alabama. Department of Agriculture and Industries
South Carolina. Department of Agriculture - Publisher:
- Athens, Ga. : United States. Department of Agriculture. National Agricultural Statistics Service. Southern Region
- Date of Original:
- 2016-09-06
- Subject:
- Chickens--Hatcheries--Southern States--Statistics--Periodicals
Broilers (Chickens)--Southern States--Statistics--Periodicals
Poultry industry--Southern States--Statistics--Periodicals
Official reports
Tables (documents) - Location:
- United States, Georgia, 32.75042, -83.50018
- Medium:
- serials (publications)
- Type:
- Text
- Format:
- application/pdf
- Description:
- This news release contains Georgia agricultural statistics.
- External Identifiers:
- Call Number GA A400.C7 P1 H2 2018/9-6
- Metadata URL:
- https://dlg.galileo.usg.edu/id:dlg_ggpd_i-ga-ba400-pc7-bp1-bh2-b2018-s9-h6-belec-p-btext
- Digital Object URL:
- https://dlg.galileo.usg.edu/do:dlg_ggpd_i-ga-ba400-pc7-bp1-bh2-b2018-s9-h6-belec-p-btext
- Language:
- eng
- Holding Institution:
- University of Georgia. Map and Government Information Library
- Rights:
-

United States Department of Agriculture National Agricultural Statistics Service
Southern Region News Release Broiler Hatchery
Cooperating with the Alabama Department of Agriculture and Industries, Florida Department of Agriculture and Consumer Services, Georgia Department of Agriculture, and South Carolina Department of Agriculture
Southern Regional Field Office 355 East Hancock Avenue, Suite 100 Athens, GA 30601 (706) 546-2236 www.nass.usda.gov
September 6, 2018
Media Contact: Jim Ewing
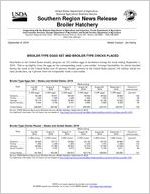
BROILER-TYPE EGGS SET AND BROILER-TYPE CHICKS PLACED
Hatcheries in the United States weekly program set 221 million eggs in incubators during the week ending September 1, 2018. This is up slightly from the eggs set the corresponding week a year earlier. Average hatchability for chicks hatched during the week in the United States was 83 percent. Broiler growers in the United States placed 185 million chicks for meat production, up 1 percent from the comparable week a year earlier.
Broiler-Type Eggs Set States and United States: 2018
State
Alabama ............. Florida ................ Georgia .............. South Carolina....
July 28, 2018
(1,000 eggs)
30,446 1,225
35,179 5,844
August 4, 2018
(1,000 eggs)
30,571 1,225
34,987 5,759
August 11, 2018
(1,000 eggs)
30,235 1,225
35,067 5,337
Week ending
August 18, 2018
(1,000 eggs)
30,564 1,225
33,468 5,980
August 25, 2018
(1,000 eggs)
30,922 1,225
34,158 5,826
September 1, 2018
(1,000 eggs)
29,894 1,178
34,283 5,405
Percent of previous year
(percent)
102 96
100 95
United States ......
228,893
229,384
227,117
226,900
224,974
220,947
100
Source: USDA National Agricultural Statistics Service, Broiler Hatchery, September 6, 2018. For additional information, the full report can be viewed at http://usda.mannlib.cornell.edu/MannUsda/viewDocumentInfo.do?documentID=1010
Broiler-Type Chicks Placed States and United States: 2018
Week ending
State
July 28, 2018
August 4, 2018
August 11, 2018
August 18, 2018
(1,000 chicks) (1,000 chicks) (1,000 chicks) (1,000 chicks)
Alabama ............. Florida ................ Georgia .............. South Carolina....
23,409 1,354
28,092 4,719
23,177 1,255
27,455 4,787
23,802 1,405
28,203 4,573
23,190 1,249
27,318 5,034
August 25, 2018
(1,000 chicks)
23,732 1,374
27,348 5,154
September 1, 2018
(1,000 chicks)
22,864 1,446
27,926 4,911
Percent of previous year
(percent)
103 110 101
86
United States ......
187,006
184,393
185,810
184,718
186,600
184,550
101
Source: USDA National Agricultural Statistics Service, Broiler Hatchery, September 6, 2018. For additional information, the full report can be viewed at http://usda.mannlib.cornell.edu/MannUsda/viewDocumentInfo.do?documentID=1010
USDA is an equal opportunity provider and employer. All NASS reports are available, at no cost, on the NASS website: http://www.nass.usda.gov
Broiler-Type Eggs Set Selected States and United States: 2018
State
July 28, 2018
August 4, 2018
Week ending
August 11, 2018
August 18, 2018
(1,000 eggs)
(1,000 eggs)
(1,000 eggs)
(1,000 eggs)
Alabama ............................................. Arkansas ............................................ Delaware ............................................ Florida ................................................ Georgia .............................................. Kentucky ............................................. Louisiana ............................................ Maryland ............................................. Mississippi .......................................... Missouri ..............................................
30,446 24,738
4,915 1,225 35,179 7,963 3,712 8,222 17,850 8,357
30,571 24,704
4,890 1,225 34,987 7,815 3,712 8,228 18,384 8,707
30,235 24,705
4,889 1,225 35,067 7,870 3,705 8,198 18,208 8,616
30,564 24,581
4,890 1,225 33,468 7,822 3,618 8,207 18,205 8,523
North Carolina .................................... Oklahoma ........................................... Pennsylvania ...................................... South Carolina .................................... Texas ................................................. Virginia ............................................... California, Tennessee,
and West Virginia ..............................
21,974 8,005 5,787 5,844
16,275 6,439
12,665
22,537 7,684 5,351 5,759
16,500 6,440
12,360
22,335 7,672 5,348 5,337
15,874 6,422
12,147
22,186 7,859 5,886 5,980
15,823 6,410
12,209
Other States .......................................
9,297
9,530
9,264
9,444
United States ...................................... Percent of previous year .....................
228,893 101
229,384 101
227,117 101
226,900 100
August 25, 2018
(1,000 eggs)
30,922 24,428
4,653 1,225 34,158 7,792 3,707 8,199 17,225 8,528
22,147 7,694 5,473 5,826
15,969 6,410
11,084
9,534
224,974 100
September 1, 2018
(1,000 eggs)
29,894 24,365
4,635 1,178 34,283 7,510 3,554 8,128 18,117 8,474
21,192 7,510 5,595 5,405
13,629 6,247
11,875
9,356
220,947 100
Broiler-Type Chicks Placed Selected States and United States: 2018
State
July 28, 2018
August 4, 2018
Week ending
August 11, 2018
August 18, 2018
(1,000 chicks) (1,000 chicks) (1,000 chicks) (1,000 chicks)
Alabama ............................................. Arkansas ............................................ Delaware ............................................ Florida ................................................ Georgia .............................................. Kentucky ............................................. Louisiana ............................................ Maryland ............................................. Mississippi .......................................... Missouri ..............................................
23,409 22,139
4,841 1,354 28,092 6,755 3,300 6,028 15,648 6,160
23,177 23,335
5,415 1,255 27,455 6,444 3,029 5,438 15,245 6,130
23,802 23,305
5,724 1,405 28,203 5,959 3,256 5,340 14,846 6,422
23,190 23,099
4,997 1,249 27,318 6,299 3,387 6,710 14,659 6,276
August 25, 2018
(1,000 chicks)
23,732 21,899
5,382 1,374 27,348 5,919 3,240 6,141 15,160 7,014
September 1, 2018
(1,000 chicks)
22,864 23,149
5,469 1,446 27,926 6,016 3,276 5,892 14,929 6,089
North Carolina .................................... Oklahoma ........................................... Pennsylvania ...................................... South Carolina .................................... Texas ................................................. Virginia ............................................... California, Tennessee,
and West Virginia ..............................
18,234 4,923 4,140 4,719
13,589 6,022
10,367
18,329 3,440 4,266 4,787
13,353 5,404
10,525
17,861 3,586 4,286 4,573
12,927 5,490
11,183
17,971 3,507 4,225 5,034
13,165 5,398
10,735
17,474 4,378 3,923 5,154
13,455 5,742
11,694
17,626 3,899 4,062 4,911
13,026 5,942
10,499
Other States .......................................
7,286
7,366
7,642
7,499
7,571
7,529
United States ...................................... Percent of previous year .....................
187,006 102
184,393 100
185,810 101
184,718 100
186,600 101
184,550 101
Source: USDA National Agricultural Statistics Service, Broiler Hatchery, September 6, 2018. For additional information, the full report can be viewed at http://usda.mannlib.cornell.edu/MannUsda/viewDocumentInfo.do?documentID=1010
USDA is an equal opportunity provider and employer. All NASS reports are available, at no cost, on the NASS website: http://www.nass.usda.gov