- Collection:
- Georgia Government Publications
- Serial:
- Broiler hatchery news release / United States Department of Agriculture National Agricultural Statistics Service.
- Title:
- Broiler hatchery news release, 2018 July 25
- Creator:
- United States Department of Agriculture National Agricultural Statistics Service
- Contributor to Resource:
- Georgia. Department of Agriculture
Florida. Department of Agriculture and Consumer Services
Alabama. Department of Agriculture and Industries
South Carolina. Department of Agriculture - Publisher:
- Athens, Ga. : United States. Department of Agriculture. National Agricultural Statistics Service. Southern Region
- Date of Original:
- 2018-07-25
- Subject:
- Chickens--Hatcheries--Southern States--Statistics--Periodicals
Broilers (Chickens)--Southern States--Statistics--Periodicals
Poultry industry--Southern States--Statistics--Periodicals
Official reports
Tables (documents) - Location:
- United States, Georgia, 32.75042, -83.50018
- Medium:
- serials (publications)
- Type:
- Text
- Format:
- application/pdf
- Description:
- This news release contains Georgia agricultural statistics.
- External Identifiers:
- Call Number GA A400.C7 P1 H2 2018/7-25
- Metadata URL:
- https://dlg.galileo.usg.edu/id:dlg_ggpd_i-ga-ba400-pc7-bp1-bh2-b2018-s7-h25-belec-p-btext
- Digital Object URL:
- https://dlg.galileo.usg.edu/do:dlg_ggpd_i-ga-ba400-pc7-bp1-bh2-b2018-s7-h25-belec-p-btext
- Language:
- eng
- Holding Institution:
- University of Georgia. Map and Government Information Library
- Rights:
-

United States Department of Agriculture National Agricultural Statistics Service
Southern Region News Release Broiler Hatchery
Cooperating with the Alabama Department of Agriculture and Industries, Florida Department of Agriculture and Consumer Services, Georgia Department of Agriculture, and South Carolina Department of Agriculture
Southern Regional Field Office 355 East Hancock Avenue, Suite 100 Athens, GA 30601 (706) 546-2236 www.nass.usda.gov
July 25, 2018
Media Contact: Jim Ewing
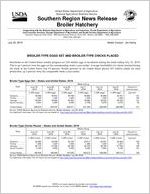
BROILER-TYPE EGGS SET AND BROILER-TYPE CHICKS PLACED
Hatcheries in the United States weekly program set 229 million eggs in incubators during the week ending July 21, 2018. This is up 1 percent from the eggs set the corresponding week a year earlier. Average hatchability for chicks hatched during the week in the United States was 83 percent. Broiler growers in the United States placed 185 million chicks for meat production, up 2 percent from the comparable week a year earlier.
Broiler-Type Eggs Set States and United States: 2018
State
Alabama ............. Florida ................ Georgia .............. South Carolina....
June 16, 2018
(1,000 eggs)
30,569 1,225
35,699 5,647
June 23, 2018
(1,000 eggs)
30,614 1,225
35,854 5,505
June 30, 2018
(1,000 eggs)
30,758 1,225
35,292 5,630
Week ending
July 7, 2018
(1,000 eggs)
30,850 1,225
35,680 5,738
July 14, 2018
(1,000 eggs)
30,896 1,225
35,632 5,679
July 21, 2018
(1,000 eggs)
30,707 1,225
35,325 5,419
Percent of previous year
(percent)
101 103 101
94
United States ......
229,818
230,310
228,471
231,494
228,283
228,586
101
Source: USDA National Agricultural Statistics Service, Broiler Hatchery, July 25, 2018. For additional information, the full report can be viewed at http://usda.mannlib.cornell.edu/MannUsda/viewDocumentInfo.do?documentID=1010
Broiler-Type Chicks Placed States and United States: 2018
Week ending
State
June 16, 2018
June 23, 2018
June 30, 2018
July 7, 2018
(1,000 chicks) (1,000 chicks) (1,000 chicks) (1,000 chicks)
Alabama ............. Florida ................ Georgia .............. South Carolina....
23,996 1,359
26,170 5,150
24,000 1,287
27,325 5,083
23,199 1,528
28,182 5,345
23,917 1,389
26,793 5,400
July 14, 2018
(1,000 chicks)
22,951 1,333
28,795 5,094
July 21, 2018
(1,000 chicks)
23,404 1,257
27,764 4,199
Percent of previous year
(percent)
103 78
100 101
United States ......
186,940
188,994
187,645
186,212
186,855
185,312
102
Source: USDA National Agricultural Statistics Service, Broiler Hatchery, July 25, 2018. For additional information, the full report can be viewed at http://usda.mannlib.cornell.edu/MannUsda/viewDocumentInfo.do?documentID=1010
USDA is an equal opportunity provider and employer. All NASS reports are available, at no cost, on the NASS website: http://www.nass.usda.gov
Broiler-Type Eggs Set Selected States and United States: 2018
State
June 16, 2018
June 23, 2018
Week ending
June 30, 2018
July 7, 2018
(1,000 eggs)
(1,000 eggs)
(1,000 eggs)
(1,000 eggs)
Alabama ............................................ Arkansas ............................................ Delaware ............................................ Florida ............................................... Georgia .............................................. Kentucky ............................................. Louisiana ............................................ Maryland ............................................. Mississippi .......................................... Missouri ..............................................
30,569 24,465
4,941 1,225 35,699 8,049 3,621 8,230 17,663 8,742
30,614 24,524
4,691 1,225 35,854 7,761 3,621 8,229 18,589 8,687
30,758 24,303
4,593 1,225 35,292 7,895 3,440 8,193 18,511 8,712
30,850 24,570
4,990 1,225 35,680 7,881 3,712 8,223 18,802 8,605
North Carolina .................................... Oklahoma ........................................... Pennsylvania ...................................... South Carolina .................................. Texas ................................................. Virginia ............................................... California, Tennessee,
and West Virginia ..............................
22,466 7,625 5,761 5,647
16,652 6,335
12,557
22,369 7,522 6,019 5,505
17,046 6,333
12,200
21,967 7,654 5,712 5,630
16,862 6,289
12,053
22,203 8,113 5,638 5,738
16,853 6,423
12,492
Other States .......................................
9,571
9,521
9,382
9,496
United States ...................................... Percent of previous year .....................
229,818 103
230,310 103
228,471 102
231,494 102
July 14, 2018
(1,000 eggs)
30,896 24,679
4,743 1,225 35,632 8,020 3,712 8,190 18,284 8,590
21,216 7,497 5,783 5,679
16,091 6,423
12,299
9,324
228,283 101
July 21, 2018
(1,000 eggs)
30,707 24,779
4,637 1,225 35,325 7,859 3,556 8,188 18,166 8,620
21,905 7,849 5,726 5,419
16,031 6,425
12,605
9,564
228,586 101
Broiler-Type Chicks Placed Selected States and United States: 2018
State
June 16, 2018
June 23, 2018
Week ending
June 30, 2018
July 7, 2018
(1,000 chicks) (1,000 chicks) (1,000 chicks) (1,000 chicks)
Alabama ............................................ Arkansas ............................................ Delaware ............................................ Florida ............................................... Georgia .............................................. Kentucky ............................................. Louisiana ............................................ Maryland ............................................. Mississippi .......................................... Missouri ..............................................
23,996 23,548
5,663 1,359 26,170 6,003 3,159 5,083 15,444 6,485
24,000 24,207
5,147 1,287 27,325 6,572 3,205 6,608 15,550 6,310
23,199 23,288
6,116 1,528 28,182 6,074 3,205 5,182 15,366 6,309
23,917 23,762
4,695 1,389 26,793 6,193 3,239 5,998 14,409 5,571
July 14, 2018
(1,000 chicks)
22,951 22,348
4,968 1,333 28,795 5,904 3,395 6,265 15,331 5,854
July 21, 2018
(1,000 chicks)
23,404 21,570
5,153 1,257 27,764 6,864 3,249 5,826 15,242 6,284
North Carolina .................................... Oklahoma ........................................... Pennsylvania ...................................... South Carolina .................................. Texas ................................................. Virginia ............................................... California, Tennessee,
and West Virginia ..............................
18,264 3,370 4,200 5,150
13,691 6,011
11,691
18,338 3,107 4,222 5,083
13,809 5,693
10,953
17,881 3,788 4,259 5,345
13,581 5,746
10,869
18,347 4,053 4,295 5,400
13,460 5,927
10,984
17,863 4,500 4,289 5,094
13,894 5,581
10,717
18,462 5,088 4,178 4,199
13,817 5,145
10,609
Other States .......................................
7,653
7,578
7,727
7,780
7,773
7,201
United States ...................................... Percent of previous year .....................
186,940 102
188,994 103
187,645 102
186,212 102
186,855 102
185,312 102
Source: USDA National Agricultural Statistics Service, Broiler Hatchery, July 25, 2018. For additional information, the full report can be viewed at http://usda.mannlib.cornell.edu/MannUsda/viewDocumentInfo.do?documentID=1010
USDA is an equal opportunity provider and employer. All NASS reports are available, at no cost, on the NASS website: http://www.nass.usda.gov