- Collection:
- Georgia Government Publications
- Serial:
- Broiler hatchery news release / United States Department of Agriculture National Agricultural Statistics Service.
- Title:
- Broiler hatchery news release, 2018 July 18
- Creator:
- United States Department of Agriculture National Agricultural Statistics Service
- Contributor to Resource:
- Georgia. Department of Agriculture
Florida. Department of Agriculture and Consumer Services
Alabama. Department of Agriculture and Industries
South Carolina. Department of Agriculture - Publisher:
- Athens, Ga. : United States. Department of Agriculture. National Agricultural Statistics Service. Southern Region
- Date of Original:
- 2018-07-18
- Subject:
- Chickens--Hatcheries--Southern States--Statistics--Periodicals
Broilers (Chickens)--Southern States--Statistics--Periodicals
Poultry industry--Southern States--Statistics--Periodicals
Official reports
Tables (documents) - Location:
- United States, Georgia, 32.75042, -83.50018
- Medium:
- serials (publications)
- Type:
- Text
- Format:
- application/pdf
- Description:
- This news release contains Georgia agricultural statistics.
- External Identifiers:
- Call Number GA A400.C7 P1 H2 2018/7-18
- Metadata URL:
- https://dlg.galileo.usg.edu/id:dlg_ggpd_i-ga-ba400-pc7-bp1-bh2-b2018-s7-h18-belec-p-btext
- Digital Object URL:
- https://dlg.galileo.usg.edu/do:dlg_ggpd_i-ga-ba400-pc7-bp1-bh2-b2018-s7-h18-belec-p-btext
- Language:
- eng
- Holding Institution:
- University of Georgia. Map and Government Information Library
- Rights:
-

United States Department of Agriculture National Agricultural Statistics Service
Southern Region News Release Broiler Hatchery
Cooperating with the Alabama Department of Agriculture and Industries, Florida Department of Agriculture and Consumer Services, Georgia Department of Agriculture, and South Carolina Department of Agriculture
Southern Regional Field Office 355 East Hancock Avenue, Suite 100 Athens, GA 30601 (706) 546-2236 www.nass.usda.gov
July 18, 2018
Media Contact: Jim Ewing
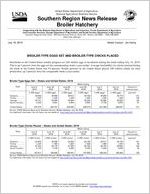
BROILER-TYPE EGGS SET AND BROILER-TYPE CHICKS PLACED
Hatcheries in the United States weekly program set 228 million eggs in incubators during the week ending July 14, 2018. This is up 1 percent from the eggs set the corresponding week a year earlier. Average hatchability for chicks hatched during the week in the United States was 83 percent. Broiler growers in the United States placed 186 million chicks for meat production, up 2 percent from the comparable week a year earlier.
Broiler-Type Eggs Set States and United States: 2018
State
Alabama ............. Florida ................ Georgia .............. South Carolina....
June 9, 2018
(1,000 eggs)
30,608 1,225
35,741 5,439
June 16, 2018
(1,000 eggs)
30,569 1,225
35,699 5,647
June 23, 2018
(1,000 eggs)
30,614 1,225
35,854 5,505
Week ending
June 30, 2018
(1,000 eggs)
30,758 1,225
35,292 5,630
July 7, 2018
(1,000 eggs)
30,850 1,225
35,680 5,738
July 14, 2018
(1,000 eggs)
30,775 1,225
35,632 5,679
Percent of previous year
(percent)
101 109 100
97
United States ......
231,275
229,747
229,954
228,975
231,582
228,097
101
Source: USDA National Agricultural Statistics Service, Broiler Hatchery, July 18, 2018. For additional information, the full report can be viewed at http://usda.mannlib.cornell.edu/MannUsda/viewDocumentInfo.do?documentID=1010
Broiler-Type Chicks Placed States and United States: 2018
Week ending
State
June 9, 2018
June 16, 2018
June 23, 2018
June 30, 2018
(1,000 chicks) (1,000 chicks) (1,000 chicks) (1,000 chicks)
Alabama ............. Florida ................ Georgia .............. South Carolina....
24,876 1,233
27,434 4,743
23,996 1,359
26,170 5,150
24,000 1,287
27,325 5,083
23,199 1,528
28,182 5,345
July 7, 2018
(1,000 chicks)
23,917 1,389
26,793 5,400
July 14, 2018
(1,000 chicks)
23,109 1,333
28,602 5,099
Percent of previous year
(percent)
101 99
102 93
United States ......
187,611
186,908
188,941
187,638
186,234
186,484
102
Source: USDA National Agricultural Statistics Service, Broiler Hatchery, July 18, 2018. For additional information, the full report can be viewed at http://usda.mannlib.cornell.edu/MannUsda/viewDocumentInfo.do?documentID=1010
USDA is an equal opportunity provider and employer. All NASS reports are available, at no cost, on the NASS website: http://www.nass.usda.gov
Broiler-Type Eggs Set Selected States and United States: 2018
State
June 9, 2018
June 16, 2018
Week ending
June 23, 2018
June 30, 2018
(1,000 eggs)
(1,000 eggs)
(1,000 eggs)
(1,000 eggs)
Alabama ............................................ Arkansas ............................................ Delaware ............................................ Florida ............................................... Georgia .............................................. Kentucky ............................................. Louisiana ............................................ Maryland ............................................. Mississippi .......................................... Missouri ..............................................
30,608 24,668
5,164 1,225 35,741 7,760 3,651 8,240 18,710 8,841
30,569 24,465
4,941 1,225 35,699 8,049 3,621 8,230 17,663 8,742
30,614 24,524
4,691 1,225 35,854 7,761 3,621 8,229 18,589 8,687
30,758 24,303
5,047 1,225 35,292 7,895 3,440 8,193 18,511 8,712
North Carolina .................................... Oklahoma ........................................... Pennsylvania ...................................... South Carolina .................................. Texas ................................................. Virginia ............................................... California, Tennessee,
and West Virginia ..............................
22,227 7,843 5,864 5,439
16,745 6,295
12,662
22,466 7,625 5,690 5,647
16,652 6,335
12,557
22,369 7,522 5,949 5,505
17,046 6,333
12,200
21,967 7,654 5,712 5,630
16,862 6,289
12,053
Other States .......................................
9,592
9,571
9,235
9,432
United States ...................................... Percent of previous year .....................
231,275 102
229,747 103
229,954 102
228,975 102
July 7, 2018
(1,000 eggs)
30,850 24,570
4,990 1,225 35,680 7,881 3,712 8,223 18,802 8,605
22,203 8,113 5,726 5,738
16,853 6,423
12,492
9,496
231,582 102
July 14, 2018
(1,000 eggs)
30,775 24,679
4,743 1,225 35,632 8,020 3,712 8,190 18,284 8,590
21,216 7,497 5,718 5,679
16,091 6,423
12,299
9,324
228,097 101
Broiler-Type Chicks Placed Selected States and United States: 2018
State
June 9, 2018
June 16, 2018
Week ending
June 23, 2018
June 30, 2018
(1,000 chicks) (1,000 chicks) (1,000 chicks) (1,000 chicks)
Alabama ............................................ Arkansas ............................................ Delaware ............................................ Florida ............................................... Georgia .............................................. Kentucky ............................................. Louisiana ............................................ Maryland ............................................. Mississippi .......................................... Missouri ..............................................
24,876 22,274
5,696 1,233 27,434 5,991 3,092 5,841 15,508 6,265
23,996 23,548
5,663 1,359 26,170 6,003 3,159 5,084 15,444 6,485
24,000 24,207
5,147 1,287 27,325 6,572 3,205 6,607 15,550 6,310
23,199 23,288
6,060 1,528 28,182 6,074 3,205 5,496 15,366 6,309
July 7, 2018
(1,000 chicks)
23,917 23,762
4,457 1,389 26,793 6,247 3,239 6,175 14,409 5,571
July 14, 2018
(1,000 chicks)
23,109 22,339
4,635 1,333 28,602 5,904 3,395 6,555 15,331 5,853
North Carolina .................................... Oklahoma ........................................... Pennsylvania ...................................... South Carolina .................................. Texas ................................................. Virginia ............................................... California, Tennessee,
and West Virginia ..............................
19,064 4,763 4,271 4,743
13,400 5,218
10,377
18,264 3,370 4,283 5,150
13,691 5,926
11,666
18,338 3,107 4,336 5,083
13,809 5,494
10,998
17,881 3,788 4,259 5,345
13,581 5,481
10,869
18,347 4,053 4,295 5,400
13,460 5,956
10,984
17,861 4,500 4,273 5,099
13,880 5,554
10,719
Other States .......................................
7,565
7,647
7,566
7,727
7,780
7,542
United States ...................................... Percent of previous year .....................
187,611 102
186,908 102
188,941 103
187,638 102
186,234 102
186,484 102
Source: USDA National Agricultural Statistics Service, Broiler Hatchery, July 18, 2018. For additional information, the full report can be viewed at http://usda.mannlib.cornell.edu/MannUsda/viewDocumentInfo.do?documentID=1010
USDA is an equal opportunity provider and employer. All NASS reports are available, at no cost, on the NASS website: http://www.nass.usda.gov