- Collection:
- Georgia Government Publications
- Serial:
- Broiler hatchery news release / United States Department of Agriculture National Agricultural Statistics Service.
- Title:
- Broiler hatchery news release, 2018 May 31
- Creator:
- United States Department of Agriculture National Agricultural Statistics Service
- Contributor to Resource:
- Georgia. Department of Agriculture
Florida. Department of Agriculture and Consumer Services
Alabama. Department of Agriculture and Industries
South Carolina. Department of Agriculture - Publisher:
- Athens, Ga. : United States. Department of Agriculture. National Agricultural Statistics Service. Southern Region
- Date of Original:
- 2018-05-31
- Subject:
- Chickens--Hatcheries--Southern States--Statistics--Periodicals
Broilers (Chickens)--Southern States--Statistics--Periodicals
Poultry industry--Southern States--Statistics--Periodicals
Official reports
Tables (documents) - Location:
- United States, Georgia, 32.75042, -83.50018
- Medium:
- serials (publications)
- Type:
- Text
- Format:
- application/pdf
- Description:
- This news release contains Georgia agricultural statistics.
- External Identifiers:
- Call Number GA A400.C7 P1 H2 2018/5-31
- Metadata URL:
- https://dlg.galileo.usg.edu/id:dlg_ggpd_i-ga-ba400-pc7-bp1-bh2-b2018-s5-h31-belec-p-btext
- Digital Object URL:
- https://dlg.galileo.usg.edu/do:dlg_ggpd_i-ga-ba400-pc7-bp1-bh2-b2018-s5-h31-belec-p-btext
- Language:
- eng
- Holding Institution:
- University of Georgia. Map and Government Information Library
- Rights:
-

United States Department of Agriculture National Agricultural Statistics Service
Southern Region News Release Broiler Hatchery
Cooperating with the Alabama Department of Agriculture and Industries, Florida Department of Agriculture and Consumer Services, Georgia Department of Agriculture, and South Carolina Department of Agriculture
Southern Regional Field Office 355 East Hancock Avenue, Suite 100 Athens, GA 30601 (706) 546-2236 www.nass.usda.gov
May 31, 2018
Media Contact: Jim Ewing
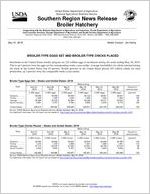
BROILER-TYPE EGGS SET AND BROILER-TYPE CHICKS PLACED
Hatcheries in the United States weekly program set 232 million eggs in incubators during the week ending May 26, 2018. This is up 3 percent from the eggs set the corresponding week a year earlier. Average hatchability for chicks hatched during the week in the United States was 82 percent. Broiler growers in the United States placed 185 million chicks for meat production, up 2 percent from the comparable week a year earlier.
Broiler-Type Eggs Set States and United States: 2018
State
Alabama ............. Florida ................ Georgia .............. South Carolina....
April 21, 2018
(1,000 eggs)
30,254 1,225
35,466 5,691
April 28, 2018
(1,000 eggs)
30,426 1,225
35,316 5,737
May 5, 2018
(1,000 eggs)
30,459 1,225
35,285 5,784
Week ending
May 12, 2018
(1,000 eggs)
30,124 1,225
35,335 5,655
May 19, 2018
(1,000 eggs)
32,991 1,224
35,471 5,675
May 26, 2018
(1,000 eggs)
32,937 1,225
33,534 5,719
Percent of previous year
(percent)
109 100
95 100
United States ......
230,414
230,594
230,826
229,811
234,100
232,249
103
Source: USDA National Agricultural Statistics Service, Broiler Hatchery, May 31, 2018. For additional information, the full report can be viewed at http://usda.mannlib.cornell.edu/MannUsda/viewDocumentInfo.do?documentID=1010
Broiler-Type Chicks Placed States and United States: 2018
Week ending
State
April 21, 2018
April 28, 2018
May 5, 2018
May 12, 2018
(1,000 chicks) (1,000 chicks) (1,000 chicks) (1,000 chicks)
Alabama ............. Florida ................ Georgia .............. South Carolina....
22,554 1,274
27,174 4,942
22,642 1,379
26,475 5,631
22,633 1,606
27,325 5,161
22,810 1,521
27,641 5,158
May 19, 2018
(1,000 chicks)
22,296 1,508
28,730 4,823
May 26, 2018
(1,000 chicks)
22,789 1,451
27,015 5,062
Percent of previous year
(percent)
103 116
99 95
United States ......
182,882
183,660
184,657
185,451
185,423
185,466
102
Source: USDA National Agricultural Statistics Service, Broiler Hatchery, May 31, 2018. For additional information, the full report can be viewed at http://usda.mannlib.cornell.edu/MannUsda/viewDocumentInfo.do?documentID=1010
USDA is an equal opportunity provider and employer. All NASS reports are available, at no cost, on the NASS website: http://www.nass.usda.gov
Broiler-Type Eggs Set Selected States and United States: 2018
State
April 21, 2018
April 28, 2018
Week ending
May 5, 2018
May 12, 2018
(1,000 eggs)
(1,000 eggs)
(1,000 eggs)
(1,000 eggs)
Alabama ............................................ Arkansas ............................................ Delaware ............................................ Florida ............................................... Georgia .............................................. Kentucky ............................................. Louisiana ............................................ Maryland ............................................. Mississippi .......................................... Missouri ..............................................
30,254 24,668
5,278 1,225 35,466 7,791 3,591 8,251 18,579 8,038
30,426 24,492
5,280 1,225 35,316 7,929 3,500 8,248 18,579 8,327
30,459 24,883
5,280 1,225 35,285 7,872 3,470 8,238 18,782 8,689
30,124 24,680
5,280 1,225 35,335 7,800 3,637 8,253 18,701 8,366
North Carolina .................................... Oklahoma ........................................... Pennsylvania ...................................... South Carolina .................................. Texas ................................................. Virginia ............................................... California, Tennessee,
and West Virginia ..............................
22,965 7,756 6,050 5,691
16,148 6,191
12,718
22,777 7,786 5,716 5,737
16,226 6,225
13,121
22,834 7,769 5,909 5,784
16,243 6,255
12,336
22,768 7,606 5,637 5,655
16,361 6,319
12,409
Other States .......................................
9,754
9,684
9,513
9,655
United States ...................................... Percent of previous year .....................
230,414 103
230,594 104
230,826 103
229,811 103
May 19, 2018
(1,000 eggs)
32,991 24,937
5,280 1,224 35,471 7,795 3,621 8,259 18,700 8,721
22,733 7,804 5,907 5,675
16,455 6,304
12,619
9,604
234,100 104
May 26, 2018
(1,000 eggs)
32,937 24,942
5,280 1,225 33,534 7,982 3,621 8,257 18,506 8,844
22,591 7,891 5,808 5,719
16,686 6,466
12,538
9,422
232,249 103
Broiler-Type Chicks Placed Selected States and United States: 2018
State
April 21, 2018
April 28, 2018
Week ending
May 5, 2018
May 12, 2018
(1,000 chicks) (1,000 chicks) (1,000 chicks) (1,000 chicks)
Alabama ............................................ Arkansas ............................................ Delaware ............................................ Florida ............................................... Georgia .............................................. Kentucky ............................................. Louisiana ............................................ Maryland ............................................. Mississippi .......................................... Missouri ..............................................
22,554 21,991
5,531 1,274 27,174 5,959 2,647 5,848 15,194 5,598
22,642 24,125
5,572 1,379 26,475 5,978 2,994 6,464 15,191 5,326
22,633 22,890
4,832 1,606 27,325 6,375 2,989 6,593 15,114 5,516
22,810 21,024
5,552 1,521 27,641 6,304 2,997 5,684 15,316 5,656
May 19, 2018
(1,000 chicks)
22,296 20,607
5,572 1,508 28,730 6,150 2,828 6,681 15,201 6,592
May 26, 2018
(1,000 chicks)
22,789 22,788
6,134 1,451 27,015 6,354 2,765 5,080 15,391 5,835
North Carolina .................................... Oklahoma ........................................... Pennsylvania ...................................... South Carolina .................................. Texas ................................................. Virginia ............................................... California, Tennessee,
and West Virginia ..............................
17,995 3,946 3,860 4,942
13,576 5,532
11,559
18,247 2,301 4,070 5,631
13,404 5,215
11,147
17,929 3,456 4,168 5,161
13,254 5,556
11,579
17,773 5,544 4,199 5,158
13,407 5,645
11,220
18,270 5,019 3,977 4,823
13,652 4,559
11,255
18,447 4,526 4,154 5,062
13,325 5,481
11,467
Other States .......................................
7,702
7,499
7,681
8,000
7,703
7,402
United States ...................................... Percent of previous year .....................
182,882 101
183,660 101
184,657 102
185,451 102
185,423 103
185,466 102
Source: USDA National Agricultural Statistics Service, Broiler Hatchery, May 31, 2018. For additional information, the full report can be viewed at http://usda.mannlib.cornell.edu/MannUsda/viewDocumentInfo.do?documentID=1010
USDA is an equal opportunity provider and employer. All NASS reports are available, at no cost, on the NASS website: http://www.nass.usda.gov