- Collection:
- Georgia Government Publications
- Serial:
- Broiler hatchery news release / United States Department of Agriculture National Agricultural Statistics Service.
- Title:
- Broiler hatchery news release, 2018 May 23
- Creator:
- United States Department of Agriculture National Agricultural Statistics Service
- Contributor to Resource:
- Georgia. Department of Agriculture
Florida. Department of Agriculture and Consumer Services
Alabama. Department of Agriculture and Industries
South Carolina. Department of Agriculture - Publisher:
- Athens, Ga. : United States. Department of Agriculture. National Agricultural Statistics Service. Southern Region
- Date of Original:
- 2018-05-23
- Subject:
- Chickens--Hatcheries--Southern States--Statistics--Periodicals
Broilers (Chickens)--Southern States--Statistics--Periodicals
Poultry industry--Southern States--Statistics--Periodicals
Official reports
Tables (documents) - Location:
- United States, Georgia, 32.75042, -83.50018
- Medium:
- serials (publications)
- Type:
- Text
- Format:
- application/pdf
- Description:
- This news release contains Georgia agricultural statistics.
- External Identifiers:
- Call Number GA A400.C7 P1 H2 2018/5-23
- Metadata URL:
- https://dlg.galileo.usg.edu/id:dlg_ggpd_i-ga-ba400-pc7-bp1-bh2-b2018-s5-h23-belec-p-btext
- Digital Object URL:
- https://dlg.galileo.usg.edu/do:dlg_ggpd_i-ga-ba400-pc7-bp1-bh2-b2018-s5-h23-belec-p-btext
- Language:
- eng
- Holding Institution:
- University of Georgia. Map and Government Information Library
- Rights:
-

United States Department of Agriculture National Agricultural Statistics Service
Southern Region News Release Broiler Hatchery
Cooperating with the Alabama Department of Agriculture and Industries, Florida Department of Agriculture and Consumer Services, Georgia Department of Agriculture, and South Carolina Department of Agriculture
Southern Regional Field Office 355 East Hancock Avenue, Suite 100 Athens, GA 30601 (706) 546-2236 www.nass.usda.gov
May 23, 2018
Media Contact: Jim Ewing
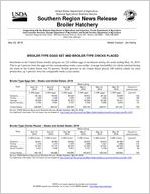
BROILER-TYPE EGGS SET AND BROILER-TYPE CHICKS PLACED
Hatcheries in the United States weekly program set 232 million eggs in incubators during the week ending May 19, 2018. This is up 3 percent from the eggs set the corresponding week a year earlier. Average hatchability for chicks hatched during the week in the United States was 82 percent. Broiler growers in the United States placed 186 million chicks for meat production, up 3 percent from the comparable week a year earlier.
Broiler-Type Eggs Set States and United States: 2018
State
Alabama ............. Florida ................ Georgia .............. South Carolina....
April 14, 2018
(1,000 eggs)
30,122 1,225
35,838 5,702
April 21, 2018
(1,000 eggs)
30,254 1,225
35,466 5,691
April 28, 2018
(1,000 eggs)
30,426 1,225
35,316 5,737
Week ending
May 5, 2018
(1,000 eggs)
30,612 1,225
35,285 5,784
May 12, 2018
(1,000 eggs)
30,124 1,225
35,335 5,655
May 19, 2018
(1,000 eggs)
30,876 1,224
35,471 5,675
Percent of previous year
(percent)
102 100 101
97
United States ......
229,895
230,414
230,594
230,742
229,811
231,931
103
Source: USDA National Agricultural Statistics Service, Broiler Hatchery, May 23, 2018. For additional information, the full report can be viewed at http://usda.mannlib.cornell.edu/MannUsda/viewDocumentInfo.do?documentID=1010
Broiler-Type Chicks Placed States and United States: 2018
Week ending
State
April 14, 2018
April 21, 2018
April 28, 2018
May 5, 2018
(1,000 chicks) (1,000 chicks) (1,000 chicks) (1,000 chicks)
Alabama ............. Florida ................ Georgia .............. South Carolina....
23,631 1,319
27,427 4,421
22,554 1,274
27,174 4,942
22,642 1,379
26,475 5,631
22,633 1,606
27,325 5,161
May 12, 2018
(1,000 chicks)
22,810 1,521
27,641 5,158
May 19, 2018
(1,000 chicks)
22,356 1,508
28,725 4,823
Percent of previous year
(percent)
102 114 106
92
United States ......
182,145
182,882
183,660
184,615
185,443
185,602
103
Source: USDA National Agricultural Statistics Service, Broiler Hatchery, May 23, 2018. For additional information, the full report can be viewed at http://usda.mannlib.cornell.edu/MannUsda/viewDocumentInfo.do?documentID=1010
USDA is an equal opportunity provider and employer. All NASS reports are available, at no cost, on the NASS website: http://www.nass.usda.gov
Broiler-Type Eggs Set Selected States and United States: 2018
State
April 14, 2018
April 21, 2018
Week ending
April 28, 2018
May 5, 2018
(1,000 eggs)
(1,000 eggs)
(1,000 eggs)
(1,000 eggs)
Alabama ............................................ Arkansas ............................................ Delaware ............................................ Florida ............................................... Georgia .............................................. Kentucky ............................................. Louisiana ............................................ Maryland ............................................. Mississippi .......................................... Missouri ..............................................
30,122 24,056
5,233 1,225 35,838 7,819 3,712 8,224 18,414 8,132
30,254 24,668
5,278 1,225 35,466 7,791 3,591 8,251 18,579 8,038
30,426 24,492
5,280 1,225 35,316 7,929 3,500 8,248 18,579 8,327
30,612 24,883
5,280 1,225 35,285 7,872 3,470 8,238 18,782 8,689
North Carolina .................................... Oklahoma ........................................... Pennsylvania ...................................... South Carolina .................................. Texas ................................................. Virginia ............................................... California, Tennessee,
and West Virginia ..............................
22,898 7,518 6,092 5,702
16,111 6,323
12,895
22,965 7,756 6,050 5,691
16,148 6,191
12,718
22,777 7,786 5,716 5,737
16,226 6,225
13,121
22,834 7,769 5,715 5,784
16,243 6,207
12,336
Other States .......................................
9,581
9,754
9,684
9,518
United States ...................................... Percent of previous year .....................
229,895 104
230,414 103
230,594 104
230,742 103
May 12, 2018
(1,000 eggs)
30,124 24,680
5,280 1,225 35,335 7,800 3,637 8,253 18,701 8,366
22,768 7,606 5,637 5,655
16,361 6,319
12,409
9,655
229,811 103
May 19, 2018
(1,000 eggs)
30,876 24,937
5,270 1,224 35,471 7,795 3,621 8,259 18,700 8,721
22,748 7,804 5,847 5,675
16,455 6,304
12,620
9,604
231,931 103
Broiler-Type Chicks Placed Selected States and United States: 2018
State
April 14, 2018
April 21, 2018
Week ending
April 28, 2018
May 5, 2018
(1,000 chicks) (1,000 chicks) (1,000 chicks) (1,000 chicks)
Alabama ............................................ Arkansas ............................................ Delaware ............................................ Florida ............................................... Georgia .............................................. Kentucky ............................................. Louisiana ............................................ Maryland ............................................. Mississippi .......................................... Missouri ..............................................
23,631 22,277
4,719 1,319 27,427 6,407 2,813 6,105 15,202 5,508
22,554 21,991
5,531 1,274 27,174 5,959 2,647 5,848 15,194 5,598
22,642 24,125
5,572 1,379 26,475 5,978 2,994 6,464 15,191 5,326
22,633 22,890
4,692 1,606 27,325 6,375 2,989 6,623 15,114 5,516
May 12, 2018
(1,000 chicks)
22,810 21,024
5,680 1,521 27,641 6,304 2,997 5,444 15,316 5,656
May 19, 2018
(1,000 chicks)
22,356 20,617
5,818 1,508 28,725 6,139 2,828 6,289 15,225 6,592
North Carolina .................................... Oklahoma ........................................... Pennsylvania ...................................... South Carolina .................................. Texas ................................................. Virginia ............................................... California, Tennessee,
and West Virginia ..............................
18,441 3,256 3,939 4,421
13,332 5,834
10,646
17,995 3,946 3,860 4,942
13,576 5,532
11,559
18,247 2,301 4,070 5,631
13,404 5,215
11,147
17,929 3,456 4,105 5,161
13,254 5,647
11,637
17,773 5,544 4,199 5,158
13,407 5,749
11,220
18,294 5,019 4,062 4,823
13,634 4,684
11,256
Other States .......................................
6,868
7,702
7,499
7,663
8,000
7,733
United States ...................................... Percent of previous year .....................
182,145 101
182,882 101
183,660 101
184,615 102
185,443 102
185,602 103
Source: USDA National Agricultural Statistics Service, Broiler Hatchery, May 23, 2018. For additional information, the full report can be viewed at http://usda.mannlib.cornell.edu/MannUsda/viewDocumentInfo.do?documentID=1010
USDA is an equal opportunity provider and employer. All NASS reports are available, at no cost, on the NASS website: http://www.nass.usda.gov