- Collection:
- Georgia Government Publications
- Serial:
- Broiler hatchery news release / United States Department of Agriculture National Agricultural Statistics Service.
- Title:
- Broiler hatchery news release, 2018 February 7
- Creator:
- United States Department of Agriculture National Agricultural Statistics Service
- Contributor to Resource:
- Georgia. Department of Agriculture
Florida. Department of Agriculture and Consumer Services
Alabama. Department of Agriculture and Industries
South Carolina. Department of Agriculture - Publisher:
- Athens, GA : United States. Department of Agriculture. National Agricultural Statistics Service. Southern Region
- Date of Original:
- 2018-02-07
- Subject:
- Chickens--Hatcheries--Southern States--Statistics--Periodicals
Broilers (Chickens)--Southern States--Statistics--Periodicals
Poultry industry--Southern States--Statistics--Periodicals
Official reports
Tables (documents) - Location:
- United States, Georgia, 32.75042, -83.50018
- Medium:
- serials (publications)
- Type:
- Text
- Format:
- application/pdf
- Description:
- This news release contains Georgia agricultural statistics.
- External Identifiers:
- Call Number GA A400.C7 P1 H2 2018/2-7
- Metadata URL:
- https://dlg.galileo.usg.edu/do:dlg_ggpd_i-ga-ba400-pc7-bp1-bh2-b2018-s2-h7-belec-p-btext
- Digital Object URL:
- https://dlg.galileo.usg.edu/do:dlg_ggpd_i-ga-ba400-pc7-bp1-bh2-b2018-s2-h7-belec-p-btext
- Language:
- eng
- Holding Institution:
- University of Georgia. Map and Government Information Library
- Rights:
-

United States Department of Agriculture National Agricultural Statistics Service
Southern Region News Release Broiler Hatchery
Cooperating with the Alabama Department of Agriculture and Industries, Florida Department of Agriculture and Consumer Services, Georgia Department of Agriculture, and South Carolina Department of Agriculture
Southern Regional Field Office 355 East Hancock Avenue, Suite 100 Athens, GA 30601 (706) 546-2236 www.nass.usda.gov
February 7, 2018
Media Contact: Jim Ewing
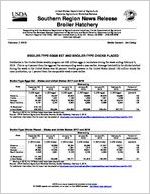
BROILER-TYPE EGGS SET AND BROILER-TYPE CHICKS PLACED
Hatcheries in the United States weekly program set 228 million eggs in incubators during the week ending February 3, 2018. This is up 4 percent from the eggs set the corresponding week a year earlier. Average hatchability for chicks hatched during the week in the United States was 82 percent. Broiler growers in the United States placed 180 million chicks for meat production, up 1 percent from the comparable week a year earlier.
Broiler-Type Eggs Set States and United States: 2017 and 2018
State
December 30, 2017
January 6, 2018
January 13, 2018
Week ending
January 20, 2018
(1,000 eggs)
(1,000 eggs)
(1,000 eggs)
(1,000 eggs)
Alabama ............. Florida ................ Georgia .............. South Carolina....
30,106 1,225
34,467 5,791
30,437 1,221
35,373 5,757
29,803 1,188
35,395 5,690
28,659 1,225
34,962 5,685
January 27, 2018
(1,000 eggs)
29,976 1,221
35,149 5,666
February 3, 2018
(1,000 eggs)
29,583 1,006
35,272 5,824
Percent of previous year
(percent)
100 100 103 109
19 State total 1 ....
216,140
United States ......
225,433
225,594
224,993
223,999
225,494
227,707
104
1 Starting in 2018, the 19 State totals have been discontinued. Source: USDA National Agricultural Statistics Service, Broiler Hatchery, February 7, 2018. For additional information, the full report can be viewed at http://usda.mannlib.cornell.edu/MannUsda/viewDocumentInfo.do?documentID=1010
Broiler-Type Chicks Placed States and United States: 2017 and 2018
State
December 30, 2017
January 6, 2018
January 13, 2018
Week ending
January 20, 2018
(1,000 chicks) (1,000 chicks) (1,000 chicks) (1,000 chicks)
Alabama ............. Florida ................ Georgia .............. South Carolina....
21,902 1,398
26,854 4,845
22,638 1,410
27,834 4,641
22,024 1,531
27,232 5,109
22,552 1,310
26,941 4,702
January 27, 2018
(1,000 chicks)
21,947 1,199
28,093 4,838
February 3, 2018
(1,000 chicks)
22,071 1,258
27,821 4,708
Percent of previous year
(percent)
103 100 100
89
19 State total 1 ....
171,728
United States ......
178,836
184,099
182,771
181,612
180,498
179,550
101
1 Starting in 2018, the 19 State totals have been discontinued.
Source: USDA National Agricultural Statistics Service, Broiler Hatchery, February 7, 2018.
For additional information, the full report can be viewed at http://usda.mannlib.cornell.edu/MannUsda/viewDocumentInfo.do?documentID=1010
USDA is an equal opportunity provider and employer. All NASS reports are available, at no cost, on the NASS website: http://www.nass.usda.gov
Broiler-Type Eggs Set 19 Selected States and United States: 2017 and 2018
State
December 30, 2017
January 6, 2018
Week ending
January 13, 2018
January 20, 2018
(1,000 eggs)
(1,000 eggs)
(1,000 eggs)
(1,000 eggs)
Alabama ............................................ Arkansas ............................................ Delaware ............................................ Florida ............................................... Georgia .............................................. Kentucky ............................................. Louisiana ............................................ Maryland ............................................. Mississippi .......................................... Missouri ..............................................
30,106 24,316
5,086 1,225 34,467 7,350 3,621 8,232 18,512 7,867
30,437 24,181
5,252 1,221 35,373 7,812 3,621 7,686 17,844 7,932
29,803 23,805
5,253 1,188 35,395 7,609 3,637 7,593 18,331 7,900
28,659 24,317
4,801 1,225 34,962 8,010 3,637 7,306 18,106 7,932
North Carolina .................................... Oklahoma ........................................... Pennsylvania ...................................... South Carolina .................................. Texas ................................................. Virginia ............................................... California, Tennessee,
and West Virginia ..............................
22,046 7,604 5,450 5,791
15,086 6,617
12,764
22,085 7,673 5,491 5,757
15,792 6,639
11,624
22,190 7,547 5,461 5,690
16,088 6,646
11,690
21,998 7,965 5,478 5,685
16,070 6,433
12,299
19 State total 1 .................................... Percent of previous year .....................
216,140 102
Other States .......................................
9,293
9,174
9,167
9,116
United States ...................................... Percent of previous year .....................
225,433 102
1 Starting in 2018, the 19 State totals have been discontinued.
225,594 103
224,993 103
223,999 102
January 27, 2018
(1,000 eggs) 29,976 24,157 5,331 1,221 35,149 7,871 3,591 7,899 18,225 8,033
21,887 7,540 4,796 5,666
16,183 6,328
12,277
9,364
225,494 102
February 3, 2018
(1,000 eggs) 29,583 24,549 5,269 1,006 35,272 7,879 3,591 8,253 18,213 7,851
22,527 7,638 5,454 5,824
16,446 6,342
12,675
9,335
227,707 104
Broiler-Type Chicks Placed 19 Selected States and United States: 2017 and 2018
State
December 30, 2017
January 6, 2018
Week ending
January 13, 2018
January 20, 2018
(1,000 chicks) (1,000 chicks) (1,000 chicks) (1,000 chicks)
Alabama ............................................ Arkansas ............................................ Delaware ............................................ Florida ............................................... Georgia .............................................. Kentucky ............................................. Louisiana ............................................ Maryland ............................................. Mississippi .......................................... Missouri ..............................................
21,902 21,419
5,758 1,398 26,854 5,893 2,602 5,783 15,796 6,242
22,638 23,371
6,486 1,410 27,834 5,789 3,132 5,237 15,562 5,911
22,024 22,347
5,552 1,531 27,232 5,939 3,092 5,507 15,485 5,821
22,552 22,157
5,153 1,310 26,941 5,391 3,118 6,062 15,470 5,960
January 27, 2018
(1,000 chicks)
21,947 21,617
4,273 1,199 28,093 5,261 3,101 6,329 14,733 6,483
February 3, 2018
(1,000 chicks)
22,071 21,768
5,604 1,258 27,821 6,441 3,101 5,591 15,223 5,471
North Carolina .................................... Oklahoma ........................................... Pennsylvania ...................................... South Carolina .................................. Texas ................................................. Virginia ............................................... California, Tennessee,
and West Virginia ..............................
16,737 4,369 4,166 4,845
12,617 4,809
10,538
18,511 2,792 4,191 4,641
13,413 5,191
10,888
17,587 4,258 4,180 5,109
13,175 5,926
10,903
17,328 3,762 4,109 4,702
12,220 6,183
11,701
17,828 3,750 4,119 4,838
12,699 6,174
10,930
17,236 3,976 4,112 4,708
12,856 5,375
9,814
19 State total 1 .................................... Percent of previous year .....................
171,728 100
Other States .......................................
7,108
7,102
7,103
7,493
7,124
7,124
United States ...................................... Percent of previous year .....................
178,836 100
184,099 103
182,771 103
181,612 101
180,498 101
179,550 101
1 Starting in 2018, the 19 State totals have been discontinued.
Source: USDA National Agricultural Statistics Service, Broiler Hatchery, February 7, 2018. For additional information, the full report can be viewed at http://usda.mannlib.cornell.edu/MannUsda/viewDocumentInfo.do?documentID=1010
USDA is an equal opportunity provider and employer. All NASS reports are available, at no cost, on the NASS website: http://www.nass.usda.gov