- Collection:
- Georgia Government Publications
- Serial:
- Broiler hatchery news release / United States Department of Agriculture National Agricultural Statistics Service.
- Title:
- Broiler hatchery news release, 2018 February 21
- Creator:
- United States Department of Agriculture National Agricultural Statistics Service
- Contributor to Resource:
- Georgia. Department of Agriculture
Florida. Department of Agriculture and Consumer Services
Alabama. Department of Agriculture and Industries
South Carolina. Department of Agriculture - Publisher:
- Athens, Ga. : United States. Department of Agriculture. National Agricultural Statistics Service. Southern Region
- Date of Original:
- 2018-02-21
- Subject:
- Chickens--Hatcheries--Southern States--Statistics--Periodicals
Broilers (Chickens)--Southern States--Statistics--Periodicals
Poultry industry--Southern States--Statistics--Periodicals
Official reports
Tables (documents) - Location:
- United States, Georgia, 32.75042, -83.50018
- Medium:
- serials (publications)
- Type:
- Text
- Format:
- application/pdf
- Description:
- This news release contains Georgia agricultural statistics.
- External Identifiers:
- Call Number GA A400.C7 P1 H2 2018/2-21
- Metadata URL:
- https://dlg.galileo.usg.edu/id:dlg_ggpd_i-ga-ba400-pc7-bp1-bh2-b2018-s2-h21-belec-p-btext
- Digital Object URL:
- https://dlg.galileo.usg.edu/do:dlg_ggpd_i-ga-ba400-pc7-bp1-bh2-b2018-s2-h21-belec-p-btext
- Language:
- eng
- Holding Institution:
- University of Georgia. Map and Government Information Library
- Rights:
-

United States Department of Agriculture National Agricultural Statistics Service
Southern Region News Release Broiler Hatchery
Cooperating with the Alabama Department of Agriculture and Industries, Florida Department of Agriculture and Consumer Services, Georgia Department of Agriculture, and South Carolina Department of Agriculture
Southern Regional Field Office 355 East Hancock Avenue, Suite 100 Athens, GA 30601 (706) 546-2236 www.nass.usda.gov
February 21, 2018
Media Contact: Jim Ewing
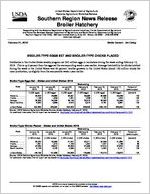
BROILER-TYPE EGGS SET AND BROILER-TYPE CHICKS PLACED
Hatcheries in the United States weekly program set 227 million eggs in incubators during the week ending February 17, 2018. This is up 2 percent from the eggs set the corresponding week a year earlier. Average hatchability for chicks hatched during the week in the United States was 82 percent. Broiler growers in the United States placed 180 million chicks for meat production, up slightly from the comparable week a year earlier.
Broiler-Type Eggs Set States and United States: 2018
State
Alabama ............. Florida ................ Georgia .............. South Carolina....
January 13, 2018
(1,000 eggs)
29,803 1,188
35,395 5,690
January 20, 2018
(1,000 eggs)
28,659 1,225
34,962 5,685
January 27, 2018
(1,000 eggs)
28,981 1,221
35,149 5,670
Week ending
February 3, 2018
(1,000 eggs)
29,583 1,006
35,272 5,813
February 10, 2018
(1,000 eggs)
29,955 1,161
35,226 5,761
February 17, 2018
(1,000 eggs)
29,486 1,224
34,835 5,667
Percent of previous year
(percent)
100 120 101 102
United States ......
224,892
223,524
224,508
226,909
226,106
226,888
102
Source: USDA National Agricultural Statistics Service, Broiler Hatchery, February 21, 2018. For additional information, the full report can be viewed at http://usda.mannlib.cornell.edu/MannUsda/viewDocumentInfo.do?documentID=1010
Broiler-Type Chicks Placed States and United States: 2018
Week ending
State
January 13, 2018
January 20, 2018
January 27, 2018
February 3, 2018
(1,000 chicks) (1,000 chicks) (1,000 chicks) (1,000 chicks)
Alabama ............. Florida ................ Georgia .............. South Carolina....
22,024 1,531
27,232 5,109
22,552 1,310
26,947 4,702
21,947 1,199
28,093 4,852
22,071 1,257
27,823 4,712
February 10, 2018
(1,000 chicks)
20,989 1,247
27,813 4,300
February 17, 2018
(1,000 chicks)
21,652 1,136
27,619 5,131
Percent of previous year
(percent)
94 86 105 105
United States ......
182,782
181,638
180,638
179,565
178,315
179,672
100
Source: USDA National Agricultural Statistics Service, Broiler Hatchery, February 21, 2018. For additional information, the full report can be viewed at http://usda.mannlib.cornell.edu/MannUsda/viewDocumentInfo.do?documentID=1010
USDA is an equal opportunity provider and employer. All NASS reports are available, at no cost, on the NASS website: http://www.nass.usda.gov
Broiler-Type Eggs Set 19 Selected States and United States: 2018
State
January 13, 2018
January 20, 2018
Week ending
January 27, 2018
February 3, 2018
(1,000 eggs)
(1,000 eggs)
(1,000 eggs)
(1,000 eggs)
Alabama ............................................ Arkansas ............................................ Delaware ............................................ Florida ............................................... Georgia .............................................. Kentucky ............................................. Louisiana ............................................ Maryland ............................................. Mississippi .......................................... Missouri ..............................................
29,803 23,805
5,253 1,188 35,395 7,609 3,637 7,593 18,331 7,900
28,659 24,317
5,305 1,225 34,962 8,010 3,637 7,306 18,106 7,932
28,981 24,157
5,331 1,221 35,149 7,871 3,591 7,899 18,225 8,033
29,583 24,549
5,269 1,006 35,272 7,879 3,591 8,253 18,213 7,851
North Carolina .................................... Oklahoma ........................................... Pennsylvania ...................................... South Carolina .................................. Texas ................................................. Virginia ............................................... California, Tennessee,
and West Virginia ..............................
22,089 7,547 5,461 5,690
16,088 6,646
11,690
21,883 7,765 5,509 5,685
16,070 6,433
11,664
21,714 7,652 5,056 5,670
16,323 6,328
11,959
22,426 7,638 4,900 5,813
16,446 6,342
12,675
Other States .......................................
9,167
9,056
9,348
9,203
United States ...................................... Percent of previous year .....................
224,892 103
223,524 102
224,508 102
226,909 103
February 10, 2018
(1,000 eggs)
29,955 24,054
5,303 1,161 35,226 7,645 3,591 7,763 18,518 8,025
21,282 7,873 5,368 5,761
16,553 6,546
12,430
9,052
226,106 102
February 17, 2018
(1,000 eggs)
29,486 24,243
5,253 1,224 34,835 7,939 3,606 8,223 18,250 7,930
22,708 7,849 5,284 5,667
16,020 6,629
12,339
9,403
226,888 102
Broiler-Type Chicks Placed 19 Selected States and United States: 2018
State
January 13, 2018
January 20, 2018
Week ending
January 27, 2018
February 3, 2018
(1,000 chicks) (1,000 chicks) (1,000 chicks) (1,000 chicks)
Alabama ............................................ Arkansas ............................................ Delaware ............................................ Florida ............................................... Georgia .............................................. Kentucky ............................................. Louisiana ............................................ Maryland ............................................. Mississippi .......................................... Missouri ..............................................
22,024 22,347
5,552 1,531 27,232 5,939 3,092 5,507 15,485 5,821
22,552 22,157
5,153 1,310 26,947 5,391 3,118 6,062 15,470 5,960
21,947 21,617
4,373 1,199 28,093 5,262 3,101 5,905 14,733 6,483
22,071 21,783
5,785 1,257 27,823 6,441 3,101 5,335 15,223 5,469
February 10, 2018
(1,000 chicks)
20,989 22,485
4,741 1,247 27,813 6,334 3,073 6,205 15,016 5,658
February 17, 2018
(1,000 chicks)
21,652 22,005
5,460 1,136 27,619 5,796 2,840 5,660 14,874 5,280
North Carolina .................................... Oklahoma ........................................... Pennsylvania ...................................... South Carolina .................................. Texas ................................................. Virginia ............................................... California, Tennessee,
and West Virginia ..............................
17,598 4,258 4,180 5,109
13,175 5,926
10,903
17,333 3,761 4,133 4,702
12,220 6,183
11,701
17,831 3,749 4,158 4,852
12,699 6,557
10,909
17,144 3,976 4,085 4,712
12,836 5,645
9,771
17,255 3,671 4,174 4,300
12,859 5,595
10,080
17,250 3,929 3,964 5,131
13,616 5,253
10,892
Other States .......................................
7,103
7,485
7,170
7,108
6,820
7,315
United States ...................................... Percent of previous year .....................
182,782 103
181,638 101
180,638 101
179,565 101
178,315 100
179,672 100
Source: USDA National Agricultural Statistics Service, Broiler Hatchery, February 21, 2018. For additional information, the full report can be viewed at http://usda.mannlib.cornell.edu/MannUsda/viewDocumentInfo.do?documentID=1010
USDA is an equal opportunity provider and employer. All NASS reports are available, at no cost, on the NASS website: http://www.nass.usda.gov