- Collection:
- Georgia Government Publications
- Serial:
- Broiler hatchery news release / United States Department of Agriculture National Agricultural Statistics Service.
- Title:
- Broiler hatchery news release, 2018 November 21
- Creator:
- United States. Department of Agriculture. National Agricultural Statistics Service. Southern Region
- Contributor to Resource:
- Georgia. Department of Agriculture
Florida. Department of Agriculture and Consumer Services
Alabama. Department of Agriculture and Industries
South Carolina. Department of Agriculture - Publisher:
- Athens, Ga. : United States. Department of Agriculture. National Agricultural Statistics Service. Southern Region
- Date of Original:
- 2018-11-21
- Subject:
- Chickens--Hatcheries--Southern States--Statistics--Periodicals
Broilers (Chickens)--Southern States--Statistics--Periodicals
Poultry industry--Southern States--Statistics--Periodicals - Location:
- United States, Georgia, 32.75042, -83.50018
- Medium:
- official reports
tables (documents) - Type:
- Text
- Format:
- application/pdf
- Description:
- This news release contains Georgia agricultural statistics.
- External Identifiers:
- Call Number GA A400.C7 P1 H2 2018/11-21
- Metadata URL:
- https://dlg.galileo.usg.edu/id:dlg_ggpd_i-ga-ba400-pc7-bp1-bh2-b2018-s11-h21-belec-p-btext
- Digital Object URL:
- https://dlg.galileo.usg.edu/do:dlg_ggpd_i-ga-ba400-pc7-bp1-bh2-b2018-s11-h21-belec-p-btext
- Language:
- eng
- Holding Institution:
- University of Georgia. Map and Government Information Library
- Rights:
-

United States Department of Agriculture National Agricultural Statistics Service
Southern Region News Release Broiler Hatchery
Cooperating with the Alabama Department of Agriculture and Industries, Florida Department of Agriculture and Consumer Services, Georgia Department of Agriculture, and South Carolina Department of Agriculture
Southern Regional Field Office 355 East Hancock Avenue, Suite 100 Athens, GA 30601 (706) 546-2236 www.nass.usda.gov
November 21, 2018
Media Contact: Jim Ewing
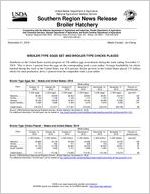
BROILER-TYPE EGGS SET AND BROILER-TYPE CHICKS PLACED
Hatcheries in the United States weekly program set 226 million eggs in incubators during the week ending November 17, 2018. This is down 1 percent from the eggs set the corresponding week a year earlier. Average hatchability for chicks hatched during the week in the United States was 82.6 percent. Broiler growers in the United States placed 175 million chicks for meat production, down 1 percent from the comparable week a year earlier.
Broiler-Type Eggs Set States and United States: 2018
State
Alabama ............. Florida ................ Georgia .............. South Carolina....
October 13, 2018
(1,000 eggs)
30,084 1,100
33,428 5,598
October 20, 2018
(1,000 eggs)
29,939 1,105
32,539 5,890
October 27, 2018
(1,000 eggs)
29,342 1,100
33,204 5,483
Week ending
November 3, 2018
(1,000 eggs)
28,964 1,147
33,464 4,976
November 10, 2018
(1,000 eggs)
30,051 1,194
33,686 5,616
November 17, 2018
(1,000 eggs)
30,215 1,194
34,890 5,939
Percent of previous year
(percent)
100 98
100 104
United States ......
216,376
214,911
217,351
215,323
222,216
225,788
99
Source: USDA National Agricultural Statistics Service, Broiler Hatchery, November 21, 2018. For additional information, the full report can be viewed at http://usda.mannlib.cornell.edu/MannUsda/viewDocumentInfo.do?documentID=1010
Broiler-Type Chicks Placed States and United States: 2018
Week ending
State
October 13, 2018
October 20, 2018
October 27, 2018
November 3, 2018
(1,000 chicks) (1,000 chicks) (1,000 chicks) (1,000 chicks)
Alabama ............. Florida ................ Georgia .............. South Carolina....
22,668 704
27,478 4,959
22,135 694
24,790 4,862
22,526 741
26,984 4,151
22,886 828
26,330 4,889
November 10, 2018
(1,000 chicks)
21,519 739
25,632 4,484
November 17, 2018
(1,000 chicks)
22,753 1,301
25,621 4,134
Percent of previous year
(percent)
106 82 97 79
United States ......
177,147
172,160
173,906
173,781
172,189
175,270
99
Source: USDA National Agricultural Statistics Service, Broiler Hatchery, November 21, 2018. For additional information, the full report can be viewed at http://usda.mannlib.cornell.edu/MannUsda/viewDocumentInfo.do?documentID=1010
USDA is an equal opportunity provider and employer. All NASS reports are available, at no cost, on the NASS website: http://www.nass.usda.gov
Broiler-Type Eggs Set Selected States and United States: 2018
State
October 13, 2018
October 20, 2018
Week ending
October 27, 2018
November 3, 2018
(1,000 eggs)
(1,000 eggs)
(1,000 eggs)
(1,000 eggs)
Alabama ............................................ Arkansas ............................................ Delaware ............................................ Florida ............................................... Georgia .............................................. Kentucky ............................................. Louisiana ............................................ Maryland ............................................. Mississippi .......................................... Missouri ..............................................
30,084 22,770
4,790 1,100 33,428 7,081 3,634 7,741 16,672 8,001
29,939 21,289
4,738 1,105 32,539 6,910 3,741 7,353 17,963 8,183
29,342 23,340
4,667 1,100 33,204 6,290 3,833 8,013 18,497 8,222
28,964 23,112
4,667 1,147 33,464 7,086 3,879 7,926 17,159 7,333
November 10, 2018
(1,000 eggs)
30,051 24,091
4,696 1,194 33,686 7,829 3,562 7,863 17,659 7,711
November 17, 2018
(1,000 eggs)
30,215 24,411
4,706 1,194 34,890 7,740 3,668 7,939 18,367 8,504
North Carolina .................................... Oklahoma ........................................... Pennsylvania ...................................... South Carolina .................................. Texas ................................................. Virginia ............................................... California, Tennessee,
and West Virginia ..............................
19,971 7,190 5,708 5,598
15,331 6,270
11,559
20,608 7,618 5,571 5,890
15,872 5,817
10,560
22,079 6,053 5,198 5,483
15,955 6,142
11,236
21,687 7,574 5,055 4,976
14,659 5,794
11,618
22,083 7,837 5,439 5,616
15,994 5,632
11,875
22,556 5,888 5,452 5,939
16,007 6,380
12,341
Other States .......................................
9,448
9,215
8,697
9,223
9,398
9,591
United States ...................................... Percent of previous year .....................
216,376 100
214,911 99
217,351 99
215,323 100
222,216 100
225,788 99
Broiler-Type Chicks Placed Selected States and United States: 2018
State
October 13, 2018
October 20, 2018
Week ending
October 27, 2018
November 3, 2018
(1,000 chicks) (1,000 chicks) (1,000 chicks) (1,000 chicks)
Alabama ............................................ Arkansas ............................................ Delaware ............................................ Florida ............................................... Georgia .............................................. Kentucky ............................................. Louisiana ............................................ Maryland ............................................. Mississippi .......................................... Missouri ..............................................
22,668 21,752
5,351 704
27,478 5,883 2,827 5,810
14,961 6,940
22,135 21,596
4,695 694
24,790 6,010 2,875 6,072
13,800 5,580
22,526 22,292
4,850 741
26,984 5,952 2,856 5,233
14,378 5,932
22,886 22,100
4,311 828
26,330 5,917 3,143 6,840
13,844 5,303
November 10, 2018
(1,000 chicks)
21,519 19,908
5,043 739
25,632 4,771 3,353 4,707
15,232 5,423
November 17, 2018
(1,000 chicks)
22,753 20,493
4,061 1,301 25,621 4,489 3,480 6,384 15,423 5,334
North Carolina .................................... Oklahoma ........................................... Pennsylvania ...................................... South Carolina .................................. Texas ................................................. Virginia ............................................... California, Tennessee,
and West Virginia ..............................
16,365 3,754 3,778 4,959
12,593 5,472
8,863
15,472 4,349 4,045 4,862
12,206 5,833
10,103
15,364 3,374 3,955 4,151
12,235 5,624
10,269
15,614 3,241 4,216 4,889
12,685 4,964
9,457
17,273 4,564 4,004 4,484
12,936 5,196
10,204
18,432 4,335 3,841 4,134
12,942 5,364
10,009
Other States .......................................
6,989
7,043
7,190
7,213
7,201
6,874
United States ...................................... Percent of previous year .....................
177,147 99
172,160 100
173,906 100
173,781 99
172,189 98
175,270 99
Source: USDA National Agricultural Statistics Service, Broiler Hatchery, November 21, 2018. For additional information, the full report can be viewed at http://usda.mannlib.cornell.edu/MannUsda/viewDocumentInfo.do?documentID=1010
USDA is an equal opportunity provider and employer. All NASS reports are available, at no cost, on the NASS website: http://www.nass.usda.gov