- Collection:
- Georgia Government Publications
- Serial:
- Broiler hatchery news release / United States Department of Agriculture National Agricultural Statistics Service.
- Title:
- Broiler hatchery news release, 2018 November 14
- Creator:
- United States. Department of Agriculture. National Agricultural Statistics Service. Southern Region
- Contributor to Resource:
- Georgia. Department of Agriculture
Florida. Department of Agriculture and Consumer Services
Alabama. Department of Agriculture and Industries
South Carolina. Department of Agriculture - Publisher:
- Athens, Ga. : United States. Department of Agriculture. National Agricultural Statistics Service. Southern Region
- Date of Original:
- 2018-11-14
- Subject:
- Chickens--Hatcheries--Southern States--Statistics--Periodicals
Broilers (Chickens)--Southern States--Statistics--Periodicals
Poultry industry--Southern States--Statistics--Periodicals - Location:
- United States, Georgia, 32.75042, -83.50018
- Medium:
- official reports
tables (documents) - Type:
- Text
- Format:
- application/pdf
- Description:
- This news release contains Georgia agricultural statistics.
- External Identifiers:
- Call Number GA A400.C7 P1 H2 2018/11-14
- Metadata URL:
- https://dlg.galileo.usg.edu/id:dlg_ggpd_i-ga-ba400-pc7-bp1-bh2-b2018-s11-h14-belec-p-btext
- Digital Object URL:
- https://dlg.galileo.usg.edu/do:dlg_ggpd_i-ga-ba400-pc7-bp1-bh2-b2018-s11-h14-belec-p-btext
- Language:
- eng
- Holding Institution:
- University of Georgia. Map and Government Information Library
- Rights:
-

United States Department of Agriculture National Agricultural Statistics Service
Southern Region News Release Broiler Hatchery
Cooperating with the Alabama Department of Agriculture and Industries, Florida Department of Agriculture and Consumer Services, Georgia Department of Agriculture, and South Carolina Department of Agriculture
Southern Regional Field Office 355 East Hancock Avenue, Suite 100 Athens, GA 30601 (706) 546-2236 www.nass.usda.gov
November 14, 2018
Media Contact: Jim Ewing
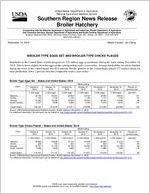
BROILER-TYPE EGGS SET AND BROILER-TYPE CHICKS PLACED
Hatcheries in the United States weekly program set 222 million eggs in incubators during the week ending November 10, 2018. This is down slightly from the eggs set the corresponding week a year earlier. Average hatchability for chicks hatched during the week in the United States was 82.6 percent. Broiler growers in the United States placed 172 million chicks for meat production, down 2 percent from the comparable week a year earlier.
Broiler-Type Eggs Set States and United States: 2018
State
Alabama ............. Florida ................ Georgia .............. South Carolina....
October 6, 2018
(1,000 eggs)
29,199 1,100
34,083 5,727
October 13, 2018
(1,000 eggs)
30,084 1,100
33,428 5,598
October 20, 2018
(1,000 eggs)
29,939 1,105
32,539 5,890
Week ending
October 27, 2018
(1,000 eggs)
29,467 1,100
32,824 5,483
November 3, 2018
(1,000 eggs)
28,964 1,147
33,464 4,976
November 10, 2018
(1,000 eggs)
29,945 1,194
33,686 5,616
Percent of previous year
(percent)
101 97 98
104
United States ......
216,422
216,376
214,911
218,895
215,350
222,062
100
Source: USDA National Agricultural Statistics Service, Broiler Hatchery, November 14, 2018. For additional information, the full report can be viewed at http://usda.mannlib.cornell.edu/MannUsda/viewDocumentInfo.do?documentID=1010
Broiler-Type Chicks Placed States and United States: 2018
Week ending
State
October 6, 2018
October 13, 2018
October 20, 2018
October 27, 2018
(1,000 chicks) (1,000 chicks) (1,000 chicks) (1,000 chicks)
Alabama ............. Florida ................ Georgia .............. South Carolina....
22,988 338
24,757 5,096
22,668 704
27,478 4,959
22,135 694
24,790 4,862
22,526 741
26,984 4,151
November 3, 2018
(1,000 chicks)
22,883 830
26,330 4,889
November 10, 2018
(1,000 chicks)
21,516 739
25,499 4,483
Percent of previous year
(percent)
101 55 90
112
United States ......
170,491
177,147
172,160
174,021
173,876
172,324
98
Source: USDA National Agricultural Statistics Service, Broiler Hatchery, November 14, 2018. For additional information, the full report can be viewed at http://usda.mannlib.cornell.edu/MannUsda/viewDocumentInfo.do?documentID=1010
USDA is an equal opportunity provider and employer. All NASS reports are available, at no cost, on the NASS website: http://www.nass.usda.gov
Broiler-Type Eggs Set Selected States and United States: 2018
State
October 6, 2018
October 13, 2018
Week ending
October 20, 2018
October 27, 2018
(1,000 eggs)
(1,000 eggs)
(1,000 eggs)
(1,000 eggs)
Alabama ............................................ Arkansas ............................................ Delaware ............................................ Florida ............................................... Georgia .............................................. Kentucky ............................................. Louisiana ............................................ Maryland ............................................. Mississippi .......................................... Missouri ..............................................
29,199 23,193
4,732 1,100 34,083 7,524 3,313 7,682 17,605 8,641
30,084 22,770
4,790 1,100 33,428 7,081 3,634 7,741 16,672 8,001
29,939 21,289
4,738 1,105 32,539 6,910 3,741 7,353 17,963 8,183
29,467 23,340
4,667 1,100 32,824 6,290 3,833 7,979 18,497 8,222
North Carolina .................................... Oklahoma ........................................... Pennsylvania ...................................... South Carolina .................................. Texas ................................................. Virginia ............................................... California, Tennessee,
and West Virginia ..............................
19,117 7,632 5,147 5,727
14,596 6,116
11,677
19,971 7,190 5,708 5,598
15,331 6,270
11,559
20,608 7,618 5,571 5,890
15,872 5,817
10,560
22,079 7,861 5,198 5,483
15,955 6,150
11,236
Other States .......................................
9,338
9,448
9,215
8,714
United States ...................................... Percent of previous year .....................
216,422 100
216,376 100
214,911 99
218,895 100
November 3, 2018
(1,000 eggs)
28,964 23,112
4,667 1,147 33,464 7,086 3,879 7,920 17,159 7,333
November 10, 2018
(1,000 eggs)
29,945 24,091
4,696 1,194 33,686 7,829 3,562 7,855 17,659 7,711
21,687 7,574 5,088 4,976
14,659 5,794
22,203 7,837 5,411 5,616
15,994 5,632
11,618
11,875
9,223
9,266
215,350 100
222,062 100
Broiler-Type Chicks Placed Selected States and United States: 2018
State
October 6, 2018
October 13, 2018
Week ending
October 20, 2018
October 27, 2018
(1,000 chicks) (1,000 chicks) (1,000 chicks) (1,000 chicks)
Alabama ............................................ Arkansas ............................................ Delaware ............................................ Florida ............................................... Georgia .............................................. Kentucky ............................................. Louisiana ............................................ Maryland ............................................. Mississippi .......................................... Missouri ..............................................
22,988 21,153
5,515 338
24,757 5,170 3,178 5,053
14,169 5,068
22,668 21,752
5,351 704
27,478 5,883 2,827 5,810
14,961 6,940
22,135 21,596
4,695 694
24,790 6,010 2,875 6,072
13,800 5,580
22,526 22,292
5,109 741
26,984 5,952 2,856 5,064
14,378 5,932
November 3, 2018
(1,000 chicks)
22,883 22,100
4,485 830
26,330 5,917 3,143 6,666
13,844 5,303
November 10, 2018
(1,000 chicks)
21,516 19,932
4,904 739
25,499 4,771 3,353 5,046
15,232 5,422
North Carolina .................................... Oklahoma ........................................... Pennsylvania ...................................... South Carolina .................................. Texas ................................................. Virginia ............................................... California, Tennessee,
and West Virginia ..............................
15,923 4,155 3,966 5,096
12,494 4,644
9,463
16,365 3,754 3,778 4,959
12,593 5,472
8,863
15,472 4,349 4,045 4,862
12,206 5,833
10,103
15,364 3,374 3,955 4,151
12,235 5,649
10,269
15,616 3,241 4,255 4,889
12,685 4,995
9,457
17,381 4,564 3,994 4,483
12,928 5,123
10,204
Other States .......................................
7,361
6,989
7,043
7,190
7,237
7,233
United States ...................................... Percent of previous year .....................
170,491 98
177,147 99
172,160 100
174,021 100
173,876 99
172,324 98
Source: USDA National Agricultural Statistics Service, Broiler Hatchery, November 14, 2018. For additional information, the full report can be viewed at http://usda.mannlib.cornell.edu/MannUsda/viewDocumentInfo.do?documentID=1010
USDA is an equal opportunity provider and employer. All NASS reports are available, at no cost, on the NASS website: http://www.nass.usda.gov