- Collection:
- Georgia Government Publications
- Serial:
- Broiler hatchery news release / United States Department of Agriculture National Agricultural Statistics Service.
- Title:
- Broiler hatchery news release, 2018 October 3
- Creator:
- United States. Department of Agriculture. National Agricultural Statistics Service. Southern Region
- Contributor to Resource:
- Georgia. Department of Agriculture
Florida. Department of Agriculture and Consumer Services
Alabama. Department of Agriculture and Industries
South Carolina. Department of Agriculture - Publisher:
- Athens, Ga. : United States. Department of Agriculture. National Agricultural Statistics Service. Southern Region
- Date of Original:
- 2018-10-03
- Subject:
- Chickens--Hatcheries--Southern States--Statistics--Periodicals
Broilers (Chickens)--Southern States--Statistics--Periodicals
Poultry industry--Southern States--Statistics--Periodicals - Location:
- United States, Georgia, 32.75042, -83.50018
- Medium:
- official reports
tables (documents) - Type:
- Text
- Format:
- application/pdf
- Description:
- This news release contains Georgia agricultural statistics.
- External Identifiers:
- Call Number GA A400.C7 P1 H2 2018/10-3
- Metadata URL:
- https://dlg.galileo.usg.edu/id:dlg_ggpd_i-ga-ba400-pc7-bp1-bh2-b2018-s10-h3-belec-p-btext
- Digital Object URL:
- https://dlg.galileo.usg.edu/do:dlg_ggpd_i-ga-ba400-pc7-bp1-bh2-b2018-s10-h3-belec-p-btext
- Language:
- eng
- Holding Institution:
- University of Georgia. Map and Government Information Library
- Rights:
-

United States Department of Agriculture National Agricultural Statistics Service
Southern Region News Release Broiler Hatchery
Cooperating with the Alabama Department of Agriculture and Industries, Florida Department of Agriculture and Consumer Services, Georgia Department of Agriculture, and South Carolina Department of Agriculture
Southern Regional Field Office 355 East Hancock Avenue, Suite 100 Athens, GA 30601 (706) 546-2236 www.nass.usda.gov
October 3, 2018
Media Contact: Jim Ewing
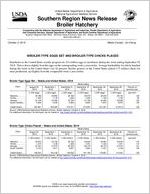
BROILER-TYPE EGGS SET AND BROILER-TYPE CHICKS PLACED
Hatcheries in the United States weekly program set 214 million eggs in incubators during the week ending September 29, 2018. This is down slightly from the eggs set the corresponding week a year earlier. Average hatchability for chicks hatched during the week in the United States was 83 percent. Broiler growers in the United States placed 175 million chicks for meat production, up slightly from the comparable week a year earlier.
Broiler-Type Eggs Set States and United States: 2018
State
Alabama ............. Florida ................ Georgia .............. South Carolina....
August 25, 2018
(1,000 eggs)
30,788 1,225
34,158 5,826
September 1, 2018
(1,000 eggs)
29,894 1,178
34,283 5,405
September 8, 2018
(1,000 eggs)
30,186 1,225
33,795 5,899
Week ending
September 15, 2018
(1,000 eggs)
29,379 1,225
31,729 5,622
September 22, 2018
(1,000 eggs)
30,042 1,100
34,653 5,972
September 29, 2018
(1,000 eggs)
28,133 1,100
32,656 5,670
Percent of previous year
(percent)
105 90
102 102
United States ......
224,861
220,263
216,341
213,287
221,551
213,613
100
Source: USDA National Agricultural Statistics Service, Broiler Hatchery, October 3, 2018. For additional information, the full report can be viewed at http://usda.mannlib.cornell.edu/MannUsda/viewDocumentInfo.do?documentID=1010
Broiler-Type Chicks Placed States and United States: 2018
Week ending
State
August 25, 2018
September 1, 2018
September 8, 2018
September 15, 2018
(1,000 chicks) (1,000 chicks) (1,000 chicks) (1,000 chicks)
Alabama ............. Florida ................ Georgia .............. South Carolina....
23,672 1,373
27,344 5,153
23,150 1,446
27,573 4,911
22,720 1,338
26,725 5,681
23,520 1,351
26,419 4,664
September 22, 2018
(1,000 chicks)
22,654 1,332
26,419 4,451
September 29, 2018
(1,000 chicks)
22,539 1,331
27,515 4,739
Percent of previous year
(percent)
104 112 101 105
United States ......
186,524
184,439
183,562
181,159
178,881
174,504
100
Source: USDA National Agricultural Statistics Service, Broiler Hatchery, October 3, 2018. For additional information, the full report can be viewed at http://usda.mannlib.cornell.edu/MannUsda/viewDocumentInfo.do?documentID=1010
USDA is an equal opportunity provider and employer. All NASS reports are available, at no cost, on the NASS website: http://www.nass.usda.gov
Broiler-Type Eggs Set Selected States and United States: 2018
State
August 25, 2018
September 1, 2018
Week ending
September 8, September 15,
2018
2018
(1,000 eggs)
(1,000 eggs)
(1,000 eggs)
(1,000 eggs)
Alabama ............................................ Arkansas ............................................ Delaware ............................................ Florida ............................................... Georgia .............................................. Kentucky ............................................. Louisiana ............................................ Maryland ............................................. Mississippi .......................................... Missouri ..............................................
30,788 24,528
4,653 1,225 34,158 7,792 3,707 8,199 17,225 8,528
29,894 24,365
4,635 1,178 34,283 7,510 3,554 8,128 17,753 8,474
30,186 22,011
4,424 1,225 33,795 6,923 3,802 8,009 17,311 8,437
29,379 22,798
4,367 1,225 31,729 6,848 3,636 7,381 17,521 7,689
September 22, 2018
(1,000 eggs)
30,042 24,286
4,609 1,100 34,653 7,260 3,225 7,923 18,270 8,331
September 29, 2018
(1,000 eggs)
28,133 24,198
4,732 1,100 32,656 7,566 3,455 8,166 17,004 7,114
North Carolina .................................... Oklahoma ........................................... Pennsylvania ...................................... South Carolina .................................. Texas ................................................. Virginia ............................................... California, Tennessee,
and West Virginia ..............................
22,147 7,694 5,406 5,826
15,969 6,410
11,084
21,082 7,510 5,481 5,405
13,612 6,247
11,876
20,169 6,783 5,295 5,899
15,446 6,104
11,170
20,453 7,479 5,747 5,622
15,304 5,776
10,760
21,471 7,446 5,330 5,972
15,429 6,396
11,090
19,264 7,799 5,488 5,670
14,877 6,255
11,187
Other States .......................................
9,522
9,276
9,352
9,573
8,718
8,949
United States ...................................... Percent of previous year .....................
224,861 100
220,263 100
216,341 100
213,287 99
221,551 100
213,613 100
Broiler-Type Chicks Placed Selected States and United States: 2018
State
August 25, 2018
September 1, 2018
Week ending
September 8, September 15,
2018
2018
(1,000 chicks) (1,000 chicks) (1,000 chicks) (1,000 chicks)
Alabama ............................................ Arkansas ............................................ Delaware ............................................ Florida ............................................... Georgia .............................................. Kentucky ............................................. Louisiana ............................................ Maryland ............................................. Mississippi .......................................... Missouri ..............................................
23,672 21,899
5,382 1,373 27,344 5,918 3,240 6,140 15,160 7,015
23,150 23,144
5,487 1,446 27,573 6,530 3,276 5,761 14,930 6,088
22,720 22,753
6,087 1,338 26,725 5,819 3,234 4,796 14,965 5,905
23,520 23,643
4,866 1,351 26,419 6,248 3,282 5,901 14,129 6,043
September 22, 2018
(1,000 chicks)
22,654 21,311
5,055 1,332 26,419 6,066 3,099 5,658 14,651 5,923
September 29, 2018
(1,000 chicks)
22,539 19,257
5,562 1,331 27,515 5,686 3,314 5,320 13,898 5,802
North Carolina .................................... Oklahoma ........................................... Pennsylvania ...................................... South Carolina .................................. Texas ................................................. Virginia ............................................... California, Tennessee,
and West Virginia ..............................
17,472 4,378 4,025 5,153
13,455 5,697
11,634
17,115 3,898 4,145 4,911
13,024 5,969
10,528
17,966 4,253 4,035 5,681
13,131 5,475
11,434
17,675 3,208 3,966 4,664
13,002 6,191
9,679
17,455 5,307 4,063 4,451
11,388 5,722
10,765
15,813 4,740 4,021 4,739
12,903 5,404
9,325
Other States .......................................
7,567
7,464
7,245
7,372
7,562
7,335
United States ...................................... Percent of previous year .....................
186,524 101
184,439 101
183,562 101
181,159 99
178,881 100
174,504 100
Source: USDA National Agricultural Statistics Service, Broiler Hatchery, October 3, 2018. For additional information, the full report can be viewed at http://usda.mannlib.cornell.edu/MannUsda/viewDocumentInfo.do?documentID=1010
USDA is an equal opportunity provider and employer. All NASS reports are available, at no cost, on the NASS website: http://www.nass.usda.gov