- Collection:
- Georgia Government Publications
- Serial:
- Broiler hatchery news release / United States Department of Agriculture National Agricultural Statistics Service.
- Title:
- Broiler hatchery news release, 2018 October 24
- Creator:
- United States. Department of Agriculture. National Agricultural Statistics Service. Southern Region
- Contributor to Resource:
- Georgia. Department of Agriculture
Florida. Department of Agriculture and Consumer Services
Alabama. Department of Agriculture and Industries
South Carolina. Department of Agriculture - Publisher:
- Athens, Ga. : United States. Department of Agriculture. National Agricultural Statistics Service. Southern Region
- Date of Original:
- 2018-10-24
- Subject:
- Chickens--Hatcheries--Southern States--Statistics--Periodicals
Broilers (Chickens)--Southern States--Statistics--Periodicals
Poultry industry--Southern States--Statistics--Periodicals - Location:
- United States, Georgia, 32.75042, -83.50018
- Medium:
- official reports
tables (documents) - Type:
- Text
- Format:
- application/pdf
- Description:
- This news release contains Georgia agricultural statistics.
- External Identifiers:
- Call Number GA A400.C7 P1 H2 2018/10-24
- Metadata URL:
- https://dlg.galileo.usg.edu/id:dlg_ggpd_i-ga-ba400-pc7-bp1-bh2-b2018-s10-h24-belec-p-btext
- Digital Object URL:
- https://dlg.galileo.usg.edu/do:dlg_ggpd_i-ga-ba400-pc7-bp1-bh2-b2018-s10-h24-belec-p-btext
- Language:
- eng
- Holding Institution:
- University of Georgia. Map and Government Information Library
- Rights:
-

United States Department of Agriculture National Agricultural Statistics Service
Southern Region News Release Broiler Hatchery
Cooperating with the Alabama Department of Agriculture and Industries, Florida Department of Agriculture and Consumer Services, Georgia Department of Agriculture, and South Carolina Department of Agriculture
Southern Regional Field Office 355 East Hancock Avenue, Suite 100 Athens, GA 30601 (706) 546-2236 www.nass.usda.gov
October 24, 2018
Media Contact: Jim Ewing
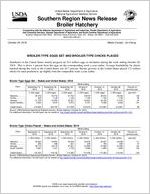
BROILER-TYPE EGGS SET AND BROILER-TYPE CHICKS PLACED
Hatcheries in the United States weekly program set 214 million eggs in incubators during the week ending October 20, 2018. This is down 1 percent from the eggs set the corresponding week a year earlier. Average hatchability for chicks hatched during the week in the United States was 82.7 percent. Broiler growers in the United States placed 172 million chicks for meat production, up slightly from the comparable week a year earlier.
Broiler-Type Eggs Set States and United States: 2018
State
Alabama ............. Florida ................ Georgia .............. South Carolina....
September 15, 2018
(1,000 eggs)
29,379 929
31,729 5,622
September 22, 2018
(1,000 eggs)
29,743 1,100
34,653 5,972
September 29, 2018
(1,000 eggs)
27,720 1,100
33,037 5,670
Week ending
October 6, 2018
(1,000 eggs)
29,578 1,100
33,891 5,727
October 13, 2018
(1,000 eggs)
29,912 1,100
33,428 5,598
October 20, 2018
(1,000 eggs)
29,483 1,105
31,975 5,890
Percent of previous year
(percent)
100 90 94
104
United States ......
212,665
220,784
214,099
216,618
215,964
213,661
99
Source: USDA National Agricultural Statistics Service, Broiler Hatchery, October 24, 2018. For additional information, the full report can be viewed at http://usda.mannlib.cornell.edu/MannUsda/viewDocumentInfo.do?documentID=1010
Broiler-Type Chicks Placed States and United States: 2018
Week ending
State
September 15, September 22, September 29,
2018
2018
2018
October 6, 2018
(1,000 chicks) (1,000 chicks) (1,000 chicks) (1,000 chicks)
Alabama ............. Florida ................ Georgia .............. South Carolina....
23,520 856
26,419 4,664
22,654 588
26,419 4,451
22,539 631
27,531 4,739
22,879 338
24,866 5,096
October 13, 2018
(1,000 chicks)
22,557 708
27,669 4,960
October 20, 2018
(1,000 chicks)
22,058 695
24,850 4,862
Percent of previous year
(percent)
111 57
104 100
United States ......
181,204
178,152
174,380
170,756
177,263
172,340
100
Source: USDA National Agricultural Statistics Service, Broiler Hatchery, October 24, 2018. For additional information, the full report can be viewed at http://usda.mannlib.cornell.edu/MannUsda/viewDocumentInfo.do?documentID=1010
USDA is an equal opportunity provider and employer. All NASS reports are available, at no cost, on the NASS website: http://www.nass.usda.gov
Broiler-Type Eggs Set Selected States and United States: 2018
State
September 15, 2018
September 22, 2018
Week ending
September 29, 2018
October 6, 2018
(1,000 eggs)
(1,000 eggs)
(1,000 eggs)
(1,000 eggs)
Alabama ............................................ Arkansas ............................................ Delaware ............................................ Florida ............................................... Georgia .............................................. Kentucky ............................................. Louisiana ............................................ Maryland ............................................. Mississippi .......................................... Missouri ..............................................
29,379 22,554
4,367 929
31,729 6,848 3,636 7,381
17,521 7,689
29,743 24,286
4,609 1,100 34,653 7,260 3,225 7,923 18,270 8,331
27,720 24,198
4,732 1,100 33,037 7,566 3,455 8,200 17,004 7,114
29,578 23,034
4,735 1,100 33,891 7,524 3,313 7,682 17,605 8,641
North Carolina .................................... Oklahoma ........................................... Pennsylvania ...................................... South Carolina .................................. Texas ................................................. Virginia ............................................... California, Tennessee,
and West Virginia ..............................
20,453 7,479 5,696 5,622
15,304 5,776
10,760
21,261 7,446 5,145 5,972
15,429 6,396
11,005
19,718 7,799 5,438 5,670
14,877 6,255
11,186
19,117 7,637 5,480 5,727
14,596 6,116
11,677
Other States .......................................
9,542
8,730
9,030
9,165
United States ...................................... Percent of previous year .....................
212,665 99
220,784 100
214,099 100
216,618 101
October 13, 2018
(1,000 eggs)
29,912 22,770
4,790 1,100 33,428 7,081 3,634 7,741 16,672 8,001
19,976 7,190 5,533 5,598
15,331 6,270
11,559
9,378
215,964 100
October 20, 2018
(1,000 eggs)
29,483 21,289
4,738 1,105 31,975 6,910 3,741 7,353 18,007 8,183
20,431 7,618 5,384 5,890
15,872 5,817
10,645
9,220
213,661 99
Broiler-Type Chicks Placed Selected States and United States: 2018
State
September 15, 2018
September 22, 2018
Week ending
September 29, 2018
October 6, 2018
(1,000 chicks) (1,000 chicks) (1,000 chicks) (1,000 chicks)
Alabama ............................................ Arkansas ............................................ Delaware ............................................ Florida ............................................... Georgia .............................................. Kentucky ............................................. Louisiana ............................................ Maryland ............................................. Mississippi .......................................... Missouri ..............................................
23,520 23,643
4,866 856
26,419 6,248 3,282 5,901
14,129 6,043
22,654 21,311
5,055 588
26,419 6,066 3,099 5,658
14,651 5,923
22,539 19,254
5,702 631
27,531 5,684 3,313 5,294
13,887 5,802
22,879 21,153
5,427 338
24,866 5,170 3,178 5,158
14,169 5,068
October 13, 2018
(1,000 chicks)
22,557 21,752
5,351 708
27,669 5,885 2,827 5,810
14,961 6,940
October 20, 2018
(1,000 chicks)
22,058 21,590
4,695 695
24,850 6,012 2,874 6,071
13,840 5,580
North Carolina .................................... Oklahoma ........................................... Pennsylvania ...................................... South Carolina .................................. Texas ................................................. Virginia ............................................... California, Tennessee,
and West Virginia ..............................
18,215 3,208 3,995 4,664
13,002 6,135
9,705
17,466 5,307 4,105 4,451
11,388 5,661
10,786
16,351 4,740 4,109 4,739
12,865 5,202
9,463
15,923 4,155 4,124 5,096
12,494 4,723
9,478
16,365 3,754 3,819 4,960
12,593 5,478
8,842
15,551 4,348 4,052 4,862
12,223 5,910
10,032
Other States .......................................
7,373
7,564
7,274
7,357
6,992
7,097
United States ...................................... Percent of previous year .....................
181,204 100
178,152 100
174,380 100
170,756 98
177,263 99
172,340 100
Source: USDA National Agricultural Statistics Service, Broiler Hatchery, October 24, 2018. For additional information, the full report can be viewed at http://usda.mannlib.cornell.edu/MannUsda/viewDocumentInfo.do?documentID=1010
USDA is an equal opportunity provider and employer. All NASS reports are available, at no cost, on the NASS website: http://www.nass.usda.gov