- Collection:
- Georgia Government Publications
- Serial:
- Broiler hatchery news release / United States Department of Agriculture National Agricultural Statistics Service.
- Title:
- Georgia weekly hatchery, 2018 January 4
- Creator:
- Georgia Agricultural Statistics Service
- Contributor to Resource:
- Georgia. Agricultural Statistics Service
- Publisher:
- Athens, Ga. : Georgia Agricultural Statistics Service
- Date of Original:
- 2018-01-04
- Subject:
- Poultry--Hatcheries--Georgia--Statistics--Periodicals
Eggs--Production--Georgia--Statistics--Periodicals - Location:
- United States, Georgia, 32.75042, -83.50018
- Medium:
- serials (publications)
- Type:
- Text
- Format:
- application/pdf
- Description:
- This news release contains Georgia agricultural statistics. Issue for Jan. 10, 2007 has title: News release. Issues for Jan. 17, 2007- have title: GA weekly hatchery news release. Issues for June 2007- have title: GA broiler hatchery news release. Also published under the title "ga-broilers weekly hatchery report."
- External Identifiers:
- Call Number GA A400.C7 P1 H2 2018/1-4
- Metadata URL:
- https://dlg.galileo.usg.edu/id:dlg_ggpd_i-ga-ba400-pc7-bp1-bh2-b2018-s1-h4-belec-p-btext
- Digital Object URL:
- https://dlg.galileo.usg.edu/do:dlg_ggpd_i-ga-ba400-pc7-bp1-bh2-b2018-s1-h4-belec-p-btext
- Language:
- eng
- Holding Institution:
- University of Georgia. Map and Government Information Library
- Rights:
-

United States Department of Agriculture National Agricultural Statistics Service
Southern Region News Release Broiler Hatchery
Cooperating with the Alabama Department of Agriculture and Industries, Florida Department of Agriculture and Consumer Services, Georgia Department of Agriculture, and South Carolina Department of Agriculture
Southern Regional Field Office 355 East Hancock Avenue, Suite 100 Athens, GA 30601 (706) 546-2236 www.nass.usda.gov
January 4, 2018
Media Contact: Jim Ewing
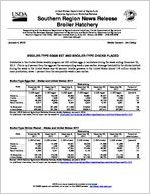
BROILER-TYPE EGGS SET AND BROILER-TYPE CHICKS PLACED
Hatcheries in the United States weekly program set 225 million eggs in incubators during the week ending December 30, 2017. This is up 2 percent from the eggs set the corresponding week a year earlier. Average hatchability for chicks hatched during the week in the United States was 82 percent. Broiler growers in the United States placed 178 million chicks for meat production, down 1 percent from the comparable week a year earlier.
Broiler-Type Eggs Set States and United States: 2017
State
Alabama ............. Florida ................ Georgia .............. South Carolina....
November 25, 2017
(1,000 eggs)
29,909 1,224
35,099 5,617
December 2, 2017
(1,000 eggs)
30,763 1,225
35,616 5,865
December 9, 2017
(1,000 eggs)
29,850 1,225
34,411 5,494
Week ending
December 16, 2017
(1,000 eggs)
30,651 1,225
35,369 5,544
December 23, 2017
(1,000 eggs)
30,407 1,223
34,709 5,757
December 30, 2017
(1,000 eggs)
30,186 1,225
34,467 5,631
Percent of previous year
(percent)
101 120 101
99
19 State total ......
216,083
221,880
211,859
219,324
218,654
215,335
102
United States ......
225,350
231,394
220,726
228,614
227,814
227,657
102
Source: USDA National Agricultural Statistics Service, Broiler Hatchery, January 4, 2018. For additional information, the full report can be viewed at http://usda.mannlib.cornell.edu/MannUsda/viewDocumentInfo.do?documentID=1010
Broiler-Type Chicks Placed States and United States: 2017
Week ending
State
November 25, 2017
December 2, 2017
December 9, 2017
December 16, 2017
(1,000 chicks) (1,000 chicks) (1,000 chicks) (1,000 chicks)
Alabama ............. Florida ................ Georgia .............. South Carolina....
20,259 1,461
25,822 4,898
21,280 1,430
27,014 4,441
22,941 1,532
27,004 5,263
22,038 1,254
27,468 4,149
December 23, 2017
(1,000 chicks)
21,559 1,392
29,067 4,943
December 30, 2017
(1,000 chicks)
21,863 1,398
29,861 4,837
Percent of previous year
(percent)
96 120 113 101
19 State total ......
167,742
170,703
176,404
175,101
178,389
171,175
99
United States ......
174,844
178,027
183,646
181,789
185,734
178,296
99
Source: USDA National Agricultural Statistics Service, Broiler Hatchery, January 4, 2018. For additional information, the full report can be viewed at http://usda.mannlib.cornell.edu/MannUsda/viewDocumentInfo.do?documentID=1010
USDA is an equal opportunity provider and employer. All NASS reports are available, at no cost, on the NASS website: http://www.nass.usda.gov
Broiler-Type Eggs Set 19 Selected States and United States: 2017
State
November 25, 2017
December 2, 2017
Week ending
December 9, 2017
December 16, 2017
(1,000 eggs)
(1,000 eggs)
(1,000 eggs)
(1,000 eggs)
Alabama ............................................ Arkansas ............................................ Delaware ............................................ Florida ............................................... Georgia .............................................. Kentucky ............................................. Louisiana ............................................ Maryland ............................................. Mississippi .......................................... Missouri ..............................................
29,909 23,859
4,916 1,224 35,099 7,080 3,591 8,253 18,405 8,319
30,763 23,860
4,913 1,225 35,616 7,977 4,029 8,256 18,451 8,317
29,850 23,718
4,916 1,225 34,411 7,709 2,926 8,249 18,663 8,316
30,651 24,149
4,916 1,225 35,369 7,993 3,591 8,253 18,544 8,201
December 23, 2017
(1,000 eggs)
30,407 23,994
4,916 1,223 34,709 8,017 3,591 8,240 18,499 8,193
December 30, 2017
(1,000 eggs)
30,186 24,096
4,916 1,225 34,467 7,350 3,621 8,232 18,512 7,772
North Carolina .................................... Oklahoma ........................................... Pennsylvania ...................................... South Carolina .................................. Texas ................................................. Virginia ............................................... California, Tennessee,
and West Virginia ..............................
21,906 7,718 5,584 5,617
16,085 6,452
12,066
23,120 7,611 5,894 5,865
16,613 6,785
12,585
20,883 7,288 5,362 5,494
15,534 6,289
11,026
22,871 7,616 5,553 5,544
16,071 6,602
12,175
22,661 7,656 5,552 5,757
16,275 6,630
12,334
22,376 7,604 5,524 5,631
15,086 6,618
12,119
19 State total ...................................... Percent of previous year .....................
216,083 102
221,880 105
211,859 100
219,324 104
218,654 104
215,335 102
Other States .......................................
9,267
9,514
8,867
9,290
9,160
9,322
United States ...................................... Percent of previous year .....................
225,350 102
231,394 105
220,726 101
228,614 104
227,814 104
224,657 102
Broiler-Type Chicks Placed 19 Selected States and United States: 2017
State
November 25, 2017
December 2, 2017
Week ending
December 9, 2017
December 16, 2017
(1,000 chicks) (1,000 chicks) (1,000 chicks) (1,000 chicks)
Alabama ............................................ Arkansas ............................................ Delaware ............................................ Florida ............................................... Georgia .............................................. Kentucky ............................................. Louisiana ............................................ Maryland ............................................. Mississippi .......................................... Missouri ..............................................
20,259 22,396
4,340 1,461 25,822 5,959 2,747 7,549 14,387 5,397
21,280 21,916
5,667 1,430 27,014 6,411 2,689 5,086 14,881 5,889
22,941 22,270
5,108 1,532 27,004 6,447 3,291 6,533 15,709 6,758
22,038 22,621
5,204 1,254 27,468 5,938 3,127 6,391 15,616 5,654
December 23, 2017
(1,000 chicks)
21,559 21,380
6,293 1,392 29,067 6,192 3,253 6,063 15,596 5,683
December 30, 2017
(1,000 chicks)
21,863 21,427
5,758 1,398 26,861 5,937 2,602 5,783 15,793 6,242
North Carolina .................................... Oklahoma ........................................... Pennsylvania ...................................... South Carolina .................................. Texas ................................................. Virginia ............................................... California, Tennessee,
and West Virginia ..............................
17,643 3,095 3,931 4,898
12,157 5,483
10,218
17,566 4,378 4,049 4,441
13,047 5,262
9,697
17,549 3,207 3,895 5,263
13,322 5,404
10,171
18,236 4,133 4,073 4,149
13,316 5,600
10,283
17,990 5,403 4,065 4,943
13,589 5,528
10,393
16,794 4,369 3,916 4,837
12,624 4,951
10,020
19 State total ...................................... Percent of previous year .....................
167,742 100
170,703 100
176,404 102
175,101 102
178,389 103
171,175 99
Other States .......................................
7,102
7,324
7,242
6,688
7,345
7,121
United States ...................................... Percent of previous year .....................
174,844 100
178,027 100
183,646 102
181,789 101
185,734 104
178,296 99
Source: USDA National Agricultural Statistics Service, Broiler Hatchery, January 4, 2018. For additional information, the full report can be viewed at http://usda.mannlib.cornell.edu/MannUsda/viewDocumentInfo.do?documentID=1010
USDA is an equal opportunity provider and employer. All NASS reports are available, at no cost, on the NASS website: http://www.nass.usda.gov