- Collection:
- Georgia Government Publications
- Serial:
- Broiler hatchery news release / United States Department of Agriculture National Agricultural Statistics Service.
- Title:
- Georgia weekly hatchery, 2018 January 24
- Creator:
- Georgia Agricultural Statistics Service
- Contributor to Resource:
- Georgia. Agricultural Statistics Service
- Publisher:
- Athens, Ga. : Georgia Agricultural Statistics Service
- Date of Original:
- 2018-01-24
- Subject:
- Poultry--Hatcheries--Georgia--Statistics--Periodicals
Eggs--Production--Georgia--Statistics--Periodicals - Location:
- United States, Georgia, 32.75042, -83.50018
- Medium:
- serials (publications)
- Type:
- Text
- Format:
- application/pdf
- Description:
- This news release contains Georgia agricultural statistics. Issue for Jan. 10, 2007 has title: News release. Issues for Jan. 17, 2007- have title: GA weekly hatchery news release. Issues for June 2007- have title: GA broiler hatchery news release. Also published under the title "ga-broilers weekly hatchery report."
- External Identifiers:
- Call Number GA A400.C7 P1 H2 2018/1-24
- Metadata URL:
- https://dlg.galileo.usg.edu/id:dlg_ggpd_i-ga-ba400-pc7-bp1-bh2-b2018-s1-h24-belec-p-btext
- Digital Object URL:
- https://dlg.galileo.usg.edu/do:dlg_ggpd_i-ga-ba400-pc7-bp1-bh2-b2018-s1-h24-belec-p-btext
- Language:
- eng
- Holding Institution:
- University of Georgia. Map and Government Information Library
- Rights:
-

United States Department of Agriculture National Agricultural Statistics Service
Southern Region News Release Broiler Hatchery
Cooperating with the Alabama Department of Agriculture and Industries, Florida Department of Agriculture and Consumer Services, Georgia Department of Agriculture, and South Carolina Department of Agriculture
Southern Regional Field Office 355 East Hancock Avenue, Suite 100 Athens, GA 30601 (706) 546-2236 www.nass.usda.gov
January 24, 2018
Media Contact: Jim Ewing
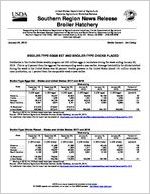
BROILER-TYPE EGGS SET AND BROILER-TYPE CHICKS PLACED
Hatcheries in the United States weekly program set 224 million eggs in incubators during the week ending January 20, 2018. This is up 2 percent from the eggs set the corresponding week a year earlier. Average hatchability for chicks hatched during the week in the United States was 82 percent. Broiler growers in the United States placed 181 million chicks for meat production, up 1 percent from the comparable week a year earlier.
Broiler-Type Eggs Set States and United States: 2017 and 2018
State
December 16, 2017
December 23, 2017
December 30, 2017
Week ending
January 6, 2018
(1,000 eggs)
(1,000 eggs)
(1,000 eggs)
(1,000 eggs)
Alabama ............. Florida ................ Georgia .............. South Carolina....
30,899 1,225
35,319 5,591
30,407 1,223
34,709 5,674
30,502 1,225
34,467 5,791
30,338 1,221
35,373 5,757
January 13, 2018
(1,000 eggs)
30,139 1,188
35,395 5,690
January 20, 2018
(1,000 eggs)
29,003 1,225
34,962 5,685
Percent of previous year
(percent)
97 128 101 105
19 State total 1 ....
219,372
218,327
215,619
United States ......
228,652
227,510
224,912
225,809
224,757
223,823
102
1 Starting in 2018, the 19 State totals have been discontinued. Source: USDA National Agricultural Statistics Service, Broiler Hatchery, January 24, 2018. For additional information, the full report can be viewed at http://usda.mannlib.cornell.edu/MannUsda/viewDocumentInfo.do?documentID=1010
Broiler-Type Chicks Placed States and United States: 2017 and 2018
State
December 16, 2017
December 23, 2017
December 30, 2017
Week ending
January 6, 2018
(1,000 chicks) (1,000 chicks) (1,000 chicks) (1,000 chicks)
Alabama ............. Florida ................ Georgia .............. South Carolina....
22,038 1,254
27,468 4,152
21,559 1,392
29,067 4,939
21,863 1,398
26,854 4,845
22,645 1,411
27,834 4,641
January 13, 2018
(1,000 chicks)
22,449 1,530
27,232 5,109
January 20, 2018
(1,000 chicks)
22,897 1,310
26,943 4,702
Percent of previous year
(percent)
105 102 103
97
19 State total 1 ....
175,099
178,348
171,085
United States ......
181,786
185,755
178,206
184,062
182,755
181,105
101
1 Starting in 2018, the 19 State totals have been discontinued.
Source: USDA National Agricultural Statistics Service, Broiler Hatchery, January 24, 2018.
For additional information, the full report can be viewed at http://usda.mannlib.cornell.edu/MannUsda/viewDocumentInfo.do?documentID=1010
USDA is an equal opportunity provider and employer. All NASS reports are available, at no cost, on the NASS website: http://www.nass.usda.gov
Broiler-Type Eggs Set 19 Selected States and United States: 2017 and 2018
State
December 16, 2017
December 23, 2017
Week ending
December 30, 2017
January 6, 2018
(1,000 eggs)
(1,000 eggs)
(1,000 eggs)
(1,000 eggs)
Alabama ............................................ Arkansas ............................................ Delaware ............................................ Florida ............................................... Georgia .............................................. Kentucky ............................................. Louisiana ............................................ Maryland ............................................. Mississippi .......................................... Missouri ..............................................
30,899 24,149
4,916 1,225 35,319 7,993 3,591 8,253 18,544 8,201
30,407 23,994
4,916 1,223 34,709 8,017 3,591 8,240 18,499 8,288
30,502 24,096
4,916 1,225 34,467 7,350 3,621 8,232 18,512 7,867
30,338 24,034
4,915 1,221 35,373 7,812 3,621 7,689 17,844 7,932
North Carolina .................................... Oklahoma ........................................... Pennsylvania ...................................... South Carolina .................................. Texas ................................................. Virginia ............................................... California, Tennessee,
and West Virginia ..............................
22,833 7,369 5,666 5,591
16,071 6,602
12,150
22,341 7,656 5,538 5,674
16,275 6,635
12,324
22,046 7,604 5,583 5,791
15,086 6,617
12,104
22,248 7,673 5,497 5,757
15,792 6,639
12,140
19 State total 1 .................................... Percent of previous year .....................
219,372 104
218,327 104
215,619 102
Other States .......................................
9,280
9,183
9,293
9,284
United States ...................................... Percent of previous year .....................
228,652 104
1 Starting in 2018, the 19 State totals have been discontinued.
227,510 104
224,912 102
225,809 103
January 13, 2018
(1,000 eggs) 30,139 23,565 4,916 1,188 35,395 7,609 3,637 7,593 18,331 7,900
22,061 7,547 5,604 5,690
16,088 6,646
11,849
8,999
224,757 103
January 20, 2018
(1,000 eggs) 29,003 24,106 4,801 1,225 34,962 8,010 3,637 7,306 18,106 7,932
21,998 7,965 5,656 5,685
16,070 6,433
11,926
9,002
223,823 102
Broiler-Type Chicks Placed 19 Selected States and United States: 2017 and 2018
State
December 16, 2017
December 23, 2017
Week ending
December 30, 2017
January 6, 2018
(1,000 chicks) (1,000 chicks) (1,000 chicks) (1,000 chicks)
Alabama ............................................ Arkansas ............................................ Delaware ............................................ Florida ............................................... Georgia .............................................. Kentucky ............................................. Louisiana ............................................ Maryland ............................................. Mississippi .......................................... Missouri ..............................................
22,038 22,621
5,204 1,254 27,468 5,938 3,127 6,392 15,616 5,654
21,559 21,380
6,293 1,392 29,067 6,192 3,253 6,064 15,587 5,683
21,863 21,419
5,758 1,398 26,854 5,893 2,602 5,783 15,796 6,242
22,645 23,371
6,486 1,411 27,834 5,789 3,132 5,237 15,562 5,911
January 13, 2018
(1,000 chicks)
22,449 22,327
5,552 1,530 27,232 5,939 3,092 5,506 15,485 5,821
January 20, 2018
(1,000 chicks)
22,897 22,162
5,153 1,310 26,943 5,391 3,118 6,062 15,459 5,960
North Carolina .................................... Oklahoma ........................................... Pennsylvania ...................................... South Carolina .................................. Texas ................................................. Virginia ............................................... California, Tennessee,
and West Virginia ..............................
18,227 4,133 4,121 4,152
13,316 5,518
10,320
17,985 5,402 4,054 4,939
13,589 5,508
10,401
16,738 4,369 3,939 4,845
12,617 4,951
10,018
18,512 2,792 4,152 4,641
13,411 5,233
10,855
17,479 4,257 4,127 5,109
13,173 5,862
10,802
17,254 3,762 4,134 4,702
12,226 6,141
11,110
19 State total 1 .................................... Percent of previous year .....................
175,099 102
178,348 103
171,085 99
Other States .......................................
6,687
7,407
7,121
7,088
7,013
7,321
United States ...................................... Percent of previous year .....................
181,786 101
185,755 104
178,206 99
184,062 103
182,755 103
181,105 101
1 Starting in 2018, the 19 State totals have been discontinued.
Source: USDA National Agricultural Statistics Service, Broiler Hatchery, January 24, 2018. For additional information, the full report can be viewed at http://usda.mannlib.cornell.edu/MannUsda/viewDocumentInfo.do?documentID=1010
USDA is an equal opportunity provider and employer. All NASS reports are available, at no cost, on the NASS website: http://www.nass.usda.gov