- Collection:
- Georgia Government Publications
- Serial:
- Broiler hatchery news release / United States Department of Agriculture National Agricultural Statistics Service.
- Title:
- Georgia weekly hatchery, 2018 January 17
- Creator:
- Georgia Agricultural Statistics Service
- Contributor to Resource:
- Georgia. Agricultural Statistics Service
- Publisher:
- Athens, Ga. : Georgia Agricultural Statistics Service
- Date of Original:
- 2018-01-17
- Subject:
- Poultry--Hatcheries--Georgia--Statistics--Periodicals
Eggs--Production--Georgia--Statistics--Periodicals - Location:
- United States, Georgia, 32.75042, -83.50018
- Medium:
- serials (publications)
- Type:
- Text
- Format:
- application/pdf
- Description:
- This news release contains Georgia agricultural statistics. Issue for Jan. 10, 2007 has title: News release. Issues for Jan. 17, 2007- have title: GA weekly hatchery news release. Issues for June 2007- have title: GA broiler hatchery news release. Also published under the title "ga-broilers weekly hatchery report."
- External Identifiers:
- Call Number GA A400.C7 P1 H2 2018/1-17
- Metadata URL:
- https://dlg.galileo.usg.edu/id:dlg_ggpd_i-ga-ba400-pc7-bp1-bh2-b2018-s1-h17-belec-p-btext
- Digital Object URL:
- https://dlg.galileo.usg.edu/do:dlg_ggpd_i-ga-ba400-pc7-bp1-bh2-b2018-s1-h17-belec-p-btext
- Language:
- eng
- Holding Institution:
- University of Georgia. Map and Government Information Library
- Rights:
-

United States Department of Agriculture National Agricultural Statistics Service
Southern Region News Release Broiler Hatchery
Cooperating with the Alabama Department of Agriculture and Industries, Florida Department of Agriculture and Consumer Services, Georgia Department of Agriculture, and South Carolina Department of Agriculture
Southern Regional Field Office 355 East Hancock Avenue, Suite 100 Athens, GA 30601 (706) 546-2236 www.nass.usda.gov
January 17, 2018
Media Contact: Jim Ewing
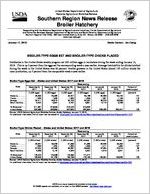
BROILER-TYPE EGGS SET AND BROILER-TYPE CHICKS PLACED
Hatcheries in the United States weekly program set 225 million eggs in incubators during the week ending January 13, 2018. This is up 3 percent from the eggs set the corresponding week a year earlier. Average hatchability for chicks hatched during the week in the United States was 82 percent. Broiler growers in the United States placed 183 million chicks for meat production, up 3 percent from the comparable week a year earlier.
Broiler-Type Eggs Set States and United States: 2017 and 2018
State
December 9, 2017
December 16, 2017
December 23, 2017
Week ending
December 30, 2017
(1,000 eggs)
(1,000 eggs)
(1,000 eggs)
(1,000 eggs)
Alabama ............. Florida ................ Georgia .............. South Carolina....
29,850 1,225
34,411 5,494
30,899 1,225
35,319 5,544
30,407 1,223
34,709 5,757
30,186 1,225
34,467 5,631
January 6, 2018
(1,000 eggs)
30,338 1,221
35,373 5,715
January 13, 2018
(1,000 eggs)
30,124 1,188
35,395 5,726
Percent of previous year
(percent)
101 116 102 107
19 State total 1 ....
211,697
219,325
218,443
215,202
United States ......
220,563
228,605
227,626
224,524
226,035
225,447
103
Source: USDA National Agricultural Statistics Service, Broiler Hatchery, January 17, 2018. For additional information, the full report can be viewed at http://usda.mannlib.cornell.edu/MannUsda/viewDocumentInfo.do?documentID=1010
Broiler-Type Chicks Placed States and United States: 2017 and 2018
Week ending
State
December 9, 2017
December 16, 2017
December 23, 2017
December 30, 2017
(1,000 chicks) (1,000 chicks) (1,000 chicks) (1,000 chicks)
Alabama ............. Florida ................ Georgia .............. South Carolina....
22,941 1,532
27,004 5,263
22,038 1,254
27,468 4,149
21,559 1,392
29,067 4,943
21,863 1,398
26,854 4,837
January 6, 2018
(1,000 chicks)
22,645 1,411
27,834 4,616
January 13, 2018
(1,000 chicks)
22,464 1,530
27,218 5,201
Percent of previous year
(percent)
107 127
98 112
19 State total 1 ....
176,400
175,096
178,352
171,077
United States ......
183,642
181,783
185,759
178,198
183,981
182,932
103
Source: USDA National Agricultural Statistics Service, Broiler Hatchery, January 17, 2018. For additional information, the full report can be viewed at http://usda.mannlib.cornell.edu/MannUsda/viewDocumentInfo.do?documentID=1010
USDA is an equal opportunity provider and employer. All NASS reports are available, at no cost, on the NASS website: http://www.nass.usda.gov
Broiler-Type Eggs Set 19 Selected States and United States: 2017 and 2018
State
December 9, 2017
December 16, 2017
Week ending
December 23, December 30,
2017
2017
(1,000 eggs)
(1,000 eggs)
(1,000 eggs)
(1,000 eggs)
Alabama ............................................ Arkansas ............................................ Delaware ............................................ Florida ............................................... Georgia .............................................. Kentucky ............................................. Louisiana ............................................ Maryland ............................................. Mississippi .......................................... Missouri ..............................................
29,850 23,718
4,916 1,225 34,411 7,709 2,926 8,249 18,663 8,316
30,899 24,149
4,916 1,225 35,319 7,993 3,591 8,253 18,544 8,201
30,407 23,994
4,916 1,223 34,709 8,017 3,591 8,240 18,499 8,288
30,186 24,096
4,916 1,225 34,467 7,350 3,621 8,232 18,512 7,867
North Carolina .................................... Oklahoma ........................................... Pennsylvania ...................................... South Carolina .................................. Texas ................................................. Virginia ............................................... California, Tennessee,
and West Virginia ..............................
20,721 7,288 5,362 5,494
15,534 6,289
11,026
22,833 7,369 5,666 5,544
16,071 6,602
12,150
22,374 7,656 5,538 5,757
16,275 6,635
12,324
22,089 7,604 5,583 5,631
15,086 6,618
12,119
19 State total 1 .................................... Percent of previous year .....................
211,697 100
219,325 104
218,443 104
215,202 102
Other States .......................................
8,866
9,280
9,183
9,322
United States ...................................... Percent of previous year .....................
220,563 100
1 Starting in 2018, the 19 State totals have been discontinued.
228,605 104
227,626 104
224,524 102
January 6, 2018
(1,000 eggs) 30,338 24,034 4,915 1,221 35,373 7,812 3,621 7,689 17,844 7,932
22,248 7,673 5,497 5,715
15,766 6,639
12,140
9,284
225,741 103
January 13, 2018
(1,000 eggs) 30,124 24,188 4,916 1,188 35,395 7,609 3,621 7,593 18,329 7,900
22,208 7,547 5,599 5,726
16,009 6,646
11,850
8,999
225,447 103
Broiler-Type Chicks Placed 19 Selected States and United States: 2017 and 2018
State
December 9, 2017
December 16, 2017
Week ending
December 23, December 30,
2017
2017
(1,000 chicks) (1,000 chicks) (1,000 chicks) (1,000 chicks)
Alabama ............................................ Arkansas ............................................ Delaware ............................................ Florida ............................................... Georgia .............................................. Kentucky ............................................. Louisiana ............................................ Maryland ............................................. Mississippi .......................................... Missouri ..............................................
22,941 22,270
5,108 1,532 27,004 6,447 3,291 6,533 15,709 6,758
22,038 22,621
5,204 1,254 27,468 5,938 3,127 6,392 15,616 5,654
21,559 21,380
6,293 1,392 29,067 6,192 3,253 6,064 15,587 5,683
21,863 21,419
5,758 1,398 26,854 5,893 2,602 5,783 15,796 6,242
January 6, 2018
(1,000 chicks)
22,645 23,371
6,336 1,411 27,834 5,789 3,132 5,331 15,562 5,911
January 13, 2018
(1,000 chicks)
22,464 22,335
5,427 1,530 27,218 5,939 3,091 5,650 15,510 5,821
North Carolina .................................... Oklahoma ........................................... Pennsylvania ...................................... South Carolina .................................. Texas ................................................. Virginia ............................................... California, Tennessee,
and West Virginia ..............................
17,546 3,207 3,895 5,263
13,322 5,404
10,170
18,227 4,133 4,121 4,149
13,316 5,518
10,320
17,985 5,402 4,054 4,943
13,589 5,508
10,401
16,738 4,369 3,939 4,837
12,617 4,951
10,018
18,512 2,792 4,152 4,616
13,411 5,233
10,855
17,503 4,257 4,137 5,201
13,173 5,862
10,801
19 State total 1 .................................... Percent of previous year .....................
176,400 102
175,096 102
178,352 103
171,077 99
Other States .......................................
7,242
6,687
7,407
7,121
7,088
7,013
United States ...................................... Percent of previous year .....................
183,642 102
181,783 101
185,759 104
178,198 99
183,981 103
182,932 103
1 Starting in 2018, the 19 State totals have been discontinued.
Source: USDA National Agricultural Statistics Service, Broiler Hatchery, January 17, 2018. For additional information, the full report can be viewed at http://usda.mannlib.cornell.edu/MannUsda/viewDocumentInfo.do?documentID=1010
USDA is an equal opportunity provider and employer. All NASS reports are available, at no cost, on the NASS website: http://www.nass.usda.gov