- Collection:
- Georgia Government Publications
- Serial:
- Broiler hatchery news release / United States Department of Agriculture National Agricultural Statistics Service.
- Title:
- Southern region broiler hatchery news release [July 19, 2017]
- Creator:
- Georgia. Agricultural Statistics Service
- Contributor to Resource:
- Georgia. Agricultural Statistics Service
- Publisher:
- Athens, GA : Georgia. Agricultural Statistics Service
- Date of Original:
- 2017-07-19
- Subject:
- Georgia
- Location:
- United States, Georgia, 32.75042, -83.50018
- Medium:
- publications (documents)
- Type:
- Text
- Format:
- application/pdf
- Description:
- Began with: August 28, 2013.
Effective March 12, 2014, name of issuing body appears as Southern Regional Field Office.
August 28, 2013; title from caption (Georgia Government Publications database, viewed January 19, 2018).
January 17, 2018 (received via e-mail on January 18, 2018 from Georgia Department of Agriculture); (Georgia Government Publications database, viewed November 22, 2017). - External Identifiers:
- Call Number GA A400.C7 P1 H2 2017/7-19
- Metadata URL:
- https://dlg.galileo.usg.edu/id:dlg_ggpd_i-ga-ba400-pc7-bp1-bh2-b2017-s7-h19-belec-p-btext
- Digital Object URL:
- https://dlg.galileo.usg.edu/do:dlg_ggpd_i-ga-ba400-pc7-bp1-bh2-b2017-s7-h19-belec-p-btext
- Language:
- eng
- Holding Institution:
- University of Georgia. Map and Government Information Library
- Rights:
-

United States Department of Agriculture National Agricultural Statistics Service
Southern Region News Release Broiler Hatchery
Cooperating with the Alabama Department of Agriculture and Industries, Florida Department of Agriculture and Consumer Services, Georgia Department of Agriculture, and South Carolina Department of Agriculture
Southern Regional Field Office 355 East Hancock Avenue, Suite 100 Athens, GA 30601 (706) 546-2236 www.nass.usda.gov
July 19, 2017
Media Contact: Jim Ewing
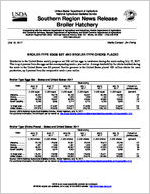
BROILER-TYPE EGGS SET AND BROILER-TYPE CHICKS PLACED
Hatcheries in the United States weekly program set 226 million eggs in incubators during the week ending July 15, 2017. This is up 4 percent from the eggs set the corresponding week a year earlier. Average hatchability for chicks hatched during the week in the United States was 83 percent. Broiler growers in the United States placed 182 million chicks for meat production, up 2 percent from the comparable week a year earlier.
Broiler-Type Eggs Set States and United States: 2017
State
Alabama ............. Florida ................ Georgia .............. South Carolina....
June 10, 2017
(1,000 eggs)
30,407 1,225
35,259 5,766
June 17, 2017
(1,000 eggs)
29,778 1,222
35,007 5,599
June 24, 2017
(1,000 eggs)
30,199 1,224
35,229 5,712
Week ending
July 1, 2017
(1,000 eggs)
30,307 1,224
34,564 5,773
July 8, 2017
(1,000 eggs)
30,765 1,190
34,999 5,706
July 15, 2017
(1,000 eggs)
30,266 1,120
35,500 5,823
Percent of previous year
(percent)
104 91
102 112
19 State total ......
217,522
214,487
214,970
214,285
216,510
216,927
103
United States ......
227,278
224,203
224,617
223,703
226,190
226,340
104
Source: USDA National Agricultural Statistics Service, Broiler Hatchery, July 19, 2017. For additional information, the full report can be viewed at http://usda.mannlib.cornell.edu/MannUsda/viewDocumentInfo.do?documentID=1010
Broiler-Type Chicks Placed States and United States: 2017
State
June 10, 2017
June 17, 2017
June 24, 2017
Week ending
July 1, 2017
(1,000 chicks) (1,000 chicks) (1,000 chicks) (1,000 chicks)
Alabama ............. Florida ................ Georgia .............. South Carolina....
22,159 1,321
29,041 5,306
22,366 1,358
27,430 5,974
22,301 1,491
28,307 4,400
22,443 1,323
27,558 5,356
July 8, 2017
(1,000 chicks)
22,613 1,352
27,224 5,291
July 15, 2017
(1,000 chicks)
22,758 1,347
27,934 5,469
Percent of previous year
(percent)
107 100
96 94
19 State total ......
175,441
176,299
175,856
176,935
175,071
174,889
101
United States ......
183,096
183,476
183,090
184,479
182,499
182,380
102
Source: USDA National Agricultural Statistics Service, Broiler Hatchery, July 19, 2017. For additional information, the full report can be viewed at http://usda.mannlib.cornell.edu/MannUsda/viewDocumentInfo.do?documentID=1010
USDA is an equal opportunity provider and employer. All NASS reports are available, at no cost, on the NASS website: http://www.nass.usda.gov
Broiler-Type Eggs Set 19 Selected States and United States: 2017
State
June 10, 2017
June 17, 2017
Week ending
June 24, 2017
July 1, 2017
(1,000 eggs)
(1,000 eggs)
(1,000 eggs)
(1,000 eggs)
Alabama ............................................. Arkansas ............................................ Delaware ............................................ Florida ................................................ Georgia .............................................. Kentucky ............................................. Louisiana ............................................ Maryland ............................................. Mississippi .......................................... Missouri ..............................................
30,407 23,843
5,071 1,225 35,259 7,619 3,531 8,224 18,208 8,370
29,778 22,740
4,987 1,222 35,007 7,379 3,712 8,256 17,541 8,404
30,199 22,893
4,962 1,224 35,229 7,806 3,424 8,231 17,552 8,409
30,307 22,259
5,029 1,224 34,564 7,620 3,697 8,111 17,982 8,280
North Carolina .................................... Oklahoma ........................................... Pennsylvania ...................................... South Carolina .................................... Texas ................................................. Virginia ............................................... California, Tennessee,
and West Virginia ..............................
22,498 7,318 4,560 5,766
16,227 6,562
12,834
22,423 7,517 4,871 5,599
15,982 6,548
12,521
21,972 7,551 4,831 5,712
16,392 6,555
12,028
21,748 7,616 4,823 5,773
16,330 6,536
12,386
19 State total ...................................... Percent of previous year .....................
217,522 103
214,487 103
214,970 103
214,285 103
Other States .......................................
9,756
9,716
9,647
9,418
United States ...................................... Percent of previous year .....................
227,278 103
224,203 103
224,617 103
223,703 104
July 8, 2017
(1,000 eggs)
30,765 23,248
4,955 1,190 34,999 7,731 3,712 8,226 17,829 8,013
22,143 7,504 4,775 5,706
16,521 6,549
12,644
216,510 103
9,680
226,190 104
July 15, 2017
(1,000 eggs)
30,266 23,183
4,962 1,120 35,500 7,795 3,727 8,228 18,038 8,528
21,755 7,512 4,850 5,823
16,623 6,584
12,433
216,927 103
9,413
226,340 104
Broiler-Type Chicks Placed 19 Selected States and United States: 2017
State
June 10, 2017
June 17, 2017
Week ending
June 24, 2017
July 1, 2017
(1,000 chicks) (1,000 chicks) (1,000 chicks) (1,000 chicks)
Alabama ............................................. Arkansas ............................................ Delaware ............................................ Florida ................................................ Georgia .............................................. Kentucky ............................................. Louisiana ............................................ Maryland ............................................. Mississippi .......................................... Missouri ..............................................
22,159 20,333
5,028 1,321 29,041 5,612 3,122 6,715 15,443 6,666
22,366 22,133
4,691 1,358 27,430 5,542 3,187 6,803 15,400 5,386
22,301 22,641
5,203 1,491 28,307 6,574 3,166 6,098 15,288 5,927
22,443 21,315
6,763 1,323 27,558 6,405 3,034 4,755 15,369 5,657
July 8, 2017
(1,000 chicks)
22,613 21,878
6,101 1,352 27,224 6,077 3,154 5,371 14,673 5,690
July 15, 2017
(1,000 chicks)
22,758 21,738
5,808 1,347 27,934 6,296 2,929 5,843 14,762 5,938
North Carolina .................................... Oklahoma ........................................... Pennsylvania ...................................... South Carolina .................................... Texas ................................................. Virginia ............................................... California, Tennessee,
and West Virginia ..............................
16,728 4,909 3,718 5,306
13,327 5,313
10,700
16,581 4,656 3,662 5,974
13,272 5,750
12,108
17,218 3,886 3,720 4,400
13,248 6,140
10,248
17,671 5,453 3,693 5,356
13,208 5,884
11,048
18,188 4,174 3,883 5,291
13,073 5,846
10,483
16,605 4,193 3,886 5,469
13,494 5,790
10,099
19 State total ...................................... Percent of previous year .....................
175,441 101
176,299 101
175,856 102
176,935 101
175,071 102
174,889 101
Other States .......................................
7,655
7,177
7,234
7,544
7,428
7,491
United States ...................................... Percent of previous year .....................
183,096 101
183,476 101
183,090 102
184,479 102
182,499 102
182,380 102
Source: USDA National Agricultural Statistics Service, Broiler Hatchery, July 19, 2017. For additional information, the full report can be viewed at http://usda.mannlib.cornell.edu/MannUsda/viewDocumentInfo.do?documentID=1010
USDA is an equal opportunity provider and employer. All NASS reports are available, at no cost, on the NASS website: http://www.nass.usda.gov