- Collection:
- Georgia Government Publications
- Serial:
- Broiler hatchery news release / United States Department of Agriculture National Agricultural Statistics Service.
- Title:
- Southern region broiler hatchery news release [July 12, 2017]
- Creator:
- Georgia. Agricultural Statistics Service
- Contributor to Resource:
- Georgia. Agricultural Statistics Service
- Publisher:
- Athens, GA : Georgia. Agricultural Statistics Service
- Date of Original:
- 2017-07-12
- Subject:
- Georgia
- Location:
- United States, Georgia, 32.75042, -83.50018
- Medium:
- publications (documents)
- Type:
- Text
- Format:
- application/pdf
- Description:
- Began with: August 28, 2013.
Effective March 12, 2014, name of issuing body appears as Southern Regional Field Office.
August 28, 2013; title from caption (Georgia Government Publications database, viewed January 19, 2018).
January 17, 2018 (received via e-mail on January 18, 2018 from Georgia Department of Agriculture); (Georgia Government Publications database, viewed November 22, 2017). - External Identifiers:
- Call Number GA A400.C7 P1 H2 2017/7-12
- Metadata URL:
- https://dlg.galileo.usg.edu/id:dlg_ggpd_i-ga-ba400-pc7-bp1-bh2-b2017-s7-h12-belec-p-btext
- Digital Object URL:
- https://dlg.galileo.usg.edu/do:dlg_ggpd_i-ga-ba400-pc7-bp1-bh2-b2017-s7-h12-belec-p-btext
- Language:
- eng
- Holding Institution:
- University of Georgia. Map and Government Information Library
- Rights:
-

United States Department of Agriculture National Agricultural Statistics Service
Southern Region News Release Broiler Hatchery
Cooperating with the Alabama Department of Agriculture and Industries, Florida Department of Agriculture and Consumer Services, Georgia Department of Agriculture, and South Carolina Department of Agriculture
Southern Regional Field Office 355 East Hancock Avenue, Suite 100 Athens, GA 30601 (706) 546-2236 www.nass.usda.gov
July 12, 2017
Media Contact: Jim Ewing
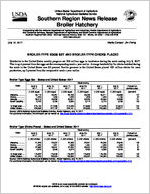
BROILER-TYPE EGGS SET AND BROILER-TYPE CHICKS PLACED
Hatcheries in the United States weekly program set 226 million eggs in incubators during the week ending July 8, 2017. This is up 4 percent from the eggs set the corresponding week a year earlier. Average hatchability for chicks hatched during the week in the United States was 83 percent. Broiler growers in the United States placed 182 million chicks for meat production, up 2 percent from the comparable week a year earlier.
Broiler-Type Eggs Set States and United States: 2017
State
Alabama ............. Florida ................ Georgia .............. South Carolina....
June 3, 2017
(1,000 eggs)
30,119 1,224
35,015 5,723
June 10, 2017
(1,000 eggs)
30,251 1,225
35,259 5,766
June 17, 2017
(1,000 eggs)
29,736 1,222
35,007 5,599
Week ending
June 24, 2017
(1,000 eggs)
30,039 1,224
35,229 5,712
July 1, 2017
(1,000 eggs)
30,211 1,224
34,564 5,773
July 8, 2017
(1,000 eggs)
30,696 1,190
34,999 5,706
Percent of previous year
(percent)
107 97
101 103
19 State total ......
215,140
217,366
214,445
214,863
214,226
216,619
103
United States ......
224,566
227,122
224,161
224,500
223,660
226,271
104
Source: USDA National Agricultural Statistics Service, Broiler Hatchery, July 12, 2017. For additional information, the full report can be viewed at http://usda.mannlib.cornell.edu/MannUsda/viewDocumentInfo.do?documentID=1010
Broiler-Type Chicks Placed States and United States: 2017
State
June 3, 2017
June 10, 2017
June 17, 2017
Week ending
June 24, 2017
(1,000 chicks) (1,000 chicks) (1,000 chicks) (1,000 chicks)
Alabama ............. Florida ................ Georgia .............. South Carolina....
21,828 1,320
27,962 4,878
22,067 1,321
29,041 5,306
22,489 1,358
27,430 5,974
22,301 1,491
28,307 4,400
July 1, 2017
(1,000 chicks)
22,309 1,323
27,558 5,356
July 8, 2017
(1,000 chicks)
22,640 1,352
27,224 5,343
Percent of previous year
(percent)
108 91 97 95
19 State total ......
174,622
175,349
176,422
175,823
176,786
175,084
102
United States ......
181,540
183,004
183,599
183,057
184,384
182,452
102
Source: USDA National Agricultural Statistics Service, Broiler Hatchery, July 12, 2017. For additional information, the full report can be viewed at http://usda.mannlib.cornell.edu/MannUsda/viewDocumentInfo.do?documentID=1010
USDA is an equal opportunity provider and employer. All NASS reports are available, at no cost, on the NASS website: http://www.nass.usda.gov
Broiler-Type Eggs Set 19 Selected States and United States: 2017
State
June 3, 2017
June 10, 2017
Week ending
June 17, 2017
June 24, 2017
(1,000 eggs)
(1,000 eggs)
(1,000 eggs)
(1,000 eggs)
Alabama ............................................. Arkansas ............................................ Delaware ............................................ Florida ................................................ Georgia .............................................. Kentucky ............................................. Louisiana ............................................ Maryland ............................................. Mississippi .......................................... Missouri ..............................................
30,119 23,448
5,045 1,224 35,015 7,673 3,606 8,253 18,103 8,452
30,251 23,843
5,071 1,225 35,259 7,619 3,531 8,224 18,208 8,370
29,736 22,740
4,987 1,222 35,007 7,379 3,712 8,256 17,541 8,404
30,039 22,893
4,962 1,224 35,229 7,806 3,424 8,231 17,552 8,409
North Carolina .................................... Oklahoma ........................................... Pennsylvania ...................................... South Carolina .................................... Texas ................................................. Virginia ............................................... California, Tennessee,
and West Virginia ..............................
21,360 7,686 4,511 5,723
16,163 6,556
12,203
22,498 7,318 4,560 5,766
16,227 6,562
12,834
22,423 7,517 4,871 5,599
15,982 6,548
12,521
22,025 7,551 4,831 5,712
16,392 6,555
12,028
19 State total ...................................... Percent of previous year .....................
215,140 102
217,366 103
214,445 103
214,863 102
Other States .......................................
9,426
9,756
9,716
9,637
United States ...................................... Percent of previous year .....................
224,566 102
227,122 103
224,161 103
224,500 103
July 1, 2017
(1,000 eggs)
30,211 22,259
5,029 1,224 34,564 7,620 3,697 8,110 17,982 8,280
21,826 7,616 4,783 5,773
16,330 6,536
12,386
214,226 103
9,434
223,660 104
July 8, 2017
(1,000 eggs)
30,696 23,248
4,957 1,190 34,999 7,731 3,712 8,226 17,829 8,013
22,367 7,504 4,727 5,706
16,521 6,549
12,644
216,619 103
9,652
226,271 104
Broiler-Type Chicks Placed 19 Selected States and United States: 2017
State
June 3, 2017
June 10, 2017
Week ending
June 17, 2017
June 24, 2017
(1,000 chicks) (1,000 chicks) (1,000 chicks) (1,000 chicks)
Alabama ............................................. Arkansas ............................................ Delaware ............................................ Florida ................................................ Georgia .............................................. Kentucky ............................................. Louisiana ............................................ Maryland ............................................. Mississippi .......................................... Missouri ..............................................
21,828 23,348
4,979 1,320 27,962 5,859 3,231 7,075 15,345 5,872
22,067 20,333
5,028 1,321 29,041 5,612 3,122 6,715 15,443 6,666
22,489 22,133
4,691 1,358 27,430 5,542 3,187 6,803 15,400 5,386
22,301 22,641
5,045 1,491 28,307 6,574 3,166 6,421 15,288 5,927
July 1, 2017
(1,000 chicks)
22,309 21,315
6,873 1,323 27,558 6,405 3,034 4,726 15,369 5,657
July 8, 2017
(1,000 chicks)
22,640 21,878
5,397 1,352 27,224 6,077 3,154 6,309 14,673 5,690
North Carolina .................................... Oklahoma ........................................... Pennsylvania ...................................... South Carolina .................................... Texas ................................................. Virginia ............................................... California, Tennessee,
and West Virginia ..............................
17,216 3,061 3,707 4,878
12,969 5,692
10,280
16,728 4,909 3,718 5,306
13,327 5,313
10,700
16,581 4,656 3,662 5,974
13,272 5,750
12,108
17,193 3,886 3,720 4,400
13,248 5,967
10,248
17,579 5,453 3,703 5,356
13,208 5,842
11,076
17,993 4,174 3,888 5,343
13,073 5,736
10,483
19 State total ...................................... Percent of previous year .....................
174,622 101
175,349 101
176,422 101
175,823 102
176,786 101
175,084 102
Other States .......................................
6,918
7,655
7,177
7,234
7,598
7,368
United States ...................................... Percent of previous year .....................
181,540 101
183,004 101
183,599 101
183,057 102
184,384 102
182,452 102
Source: USDA National Agricultural Statistics Service, Broiler Hatchery, July 12, 2017. For additional information, the full report can be viewed at http://usda.mannlib.cornell.edu/MannUsda/viewDocumentInfo.do?documentID=1010
USDA is an equal opportunity provider and employer. All NASS reports are available, at no cost, on the NASS website: http://www.nass.usda.gov