- Collection:
- Georgia Government Publications
- Serial:
- Broiler hatchery news release / United States Department of Agriculture National Agricultural Statistics Service.
- Title:
- Southern region broiler hatchery news release [June 7, 2017]
- Creator:
- Georgia. Agricultural Statistics Service
- Contributor to Resource:
- Georgia. Agricultural Statistics Service
- Publisher:
- Athens, GA : Georgia. Agricultural Statistics Service
- Date of Original:
- 2017-06-07
- Subject:
- Georgia
- Location:
- United States, Georgia, 32.75042, -83.50018
- Medium:
- publications (documents)
- Type:
- Text
- Format:
- application/pdf
- Description:
- Began with: August 28, 2013.
Effective March 12, 2014, name of issuing body appears as Southern Regional Field Office.
August 28, 2013; title from caption (Georgia Government Publications database, viewed January 19, 2018).
January 17, 2018 (received via e-mail on January 18, 2018 from Georgia Department of Agriculture); (Georgia Government Publications database, viewed November 22, 2017). - External Identifiers:
- Call Number GA A400.C7 P1 H2 2017/6-7
- Metadata URL:
- https://dlg.galileo.usg.edu/id:dlg_ggpd_i-ga-ba400-pc7-bp1-bh2-b2017-s6-h7-belec-p-btext
- Digital Object URL:
- https://dlg.galileo.usg.edu/do:dlg_ggpd_i-ga-ba400-pc7-bp1-bh2-b2017-s6-h7-belec-p-btext
- Language:
- eng
- Holding Institution:
- University of Georgia. Map and Government Information Library
- Rights:
-

United States Department of Agriculture National Agricultural Statistics Service
Southern Region News Release Broiler Hatchery
Cooperating with the Alabama Department of Agriculture and Industries, Florida Department of Agriculture and Consumer Services, Georgia Department of Agriculture, and South Carolina Department of Agriculture
Southern Regional Field Office 355 East Hancock Avenue, Suite 100 Athens, GA 30601 (706) 546-2236 www.nass.usda.gov
June 7, 2017
Media Contact: Jim Ewing
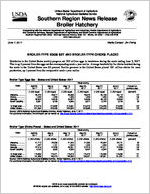
BROILER-TYPE EGGS SET AND BROILER-TYPE CHICKS PLACED
Hatcheries in the United States weekly program set 225 million eggs in incubators during the week ending June 3, 2017. This is up 2 percent from the eggs set the corresponding week a year earlier. Average hatchability for chicks hatched during the week in the United States was 83 percent. Broiler growers in the United States placed 181 million chicks for meat production, up 1 percent from the comparable week a year earlier.
Broiler-Type Eggs Set States and United States: 2017
State
Alabama ............. Florida ................ Georgia .............. South Carolina....
April 29, 2017
(1,000 eggs)
29,470 1,223
33,924 5,681
May 6, 2017
(1,000 eggs)
29,617 1,224
34,576 5,708
May 13, 2017
(1,000 eggs)
29,565 1,225
34,827 5,650
Week ending
May 20, 2017
(1,000 eggs)
29,870 1,224
34,958 5,877
May 27, 2017
(1,000 eggs)
30,156 1,225
35,125 5,722
June 3, 2017
(1,000 eggs)
30,119 1,224
34,984 5,740
Percent of previous year
(percent)
107 100 101
93
19 State total ......
212,218
213,882
214,061
215,473
215,245
215,293
102
United States ......
221,664
223,408
222,932
224,968
224,542
224,568
102
Source: USDA National Agricultural Statistics Service, Broiler Hatchery, June 7, 2017. For additional information, the full report can be viewed at http://usda.mannlib.cornell.edu/MannUsda/viewDocumentInfo.do?documentID=1010
Broiler-Type Chicks Placed States and United States: 2017
State
April 29, 2017
May 6, 2017
May 13, 2017
Week ending
May 20, 2017
(1,000 chicks) (1,000 chicks) (1,000 chicks) (1,000 chicks)
Alabama ............. Florida ................ Georgia .............. South Carolina....
21,713 1,427
27,216 4,734
22,386 1,191
27,228 4,502
21,203 1,344
29,331 4,529
21,890 1,320
27,219 5,207
May 27, 2017
(1,000 chicks)
22,394 1,253
27,311 5,322
June 3, 2017
(1,000 chicks)
22,131 1,323
27,880 4,888
Percent of previous year
(percent)
99 124 102 126
19 State total ......
174,880
173,471
174,919
173,473
175,268
174,360
101
United States ......
181,656
180,474
182,053
180,531
182,591
181,261
101
Source: USDA National Agricultural Statistics Service, Broiler Hatchery, June 7, 2017. For additional information, the full report can be viewed at http://usda.mannlib.cornell.edu/MannUsda/viewDocumentInfo.do?documentID=1010
USDA is an equal opportunity provider and employer. All NASS reports are available, at no cost, on the NASS website: http://www.nass.usda.gov
Broiler-Type Eggs Set 19 Selected States and United States: 2017
State
April 29, 2017
May 6, 2017
Week ending
May 13, 2017
May 20, 2017
(1,000 eggs)
(1,000 eggs)
(1,000 eggs)
(1,000 eggs)
Alabama ............................................. Arkansas ............................................ Delaware ............................................ Florida ................................................ Georgia .............................................. Kentucky ............................................. Louisiana ............................................ Maryland ............................................. Mississippi .......................................... Missouri ..............................................
29,470 23,322
4,980 1,223 33,924 7,310 3,530 8,261 18,154 7,879
29,617 23,811
4,825 1,224 34,576 7,215 3,637 8,225 18,303 7,916
29,565 23,867
4,755 1,225 34,827 7,421 3,591 8,188 18,029 7,897
29,870 23,635
5,009 1,224 34,958 7,483 3,592 8,256 18,134 8,238
North Carolina .................................... Oklahoma ........................................... Pennsylvania ...................................... South Carolina .................................... Texas ................................................. Virginia ............................................... California, Tennessee,
and West Virginia ..............................
21,948 7,535 4,761 5,681
15,939 6,660
11,641
22,199 7,511 4,545 5,708
16,006 6,557
12,007
22,320 7,362 4,441 5,650
16,135 6,587
12,201
22,477 7,140 4,589 5,877
16,210 6,535
12,246
19 State total ...................................... Percent of previous year .....................
212,218 102
213,882 102
214,061 102
215,473 102
Other States .......................................
9,446
9,526
8,871
9,495
United States ...................................... Percent of previous year .....................
221,664 102
223,408 103
222,932 102
224,968 102
May 27, 2017
(1,000 eggs)
30,156 23,132
5,026 1,225 35,125 7,561 3,606 8,244 18,164 8,020
22,082 7,401 4,722 5,722
16,251 6,585
12,223
215,245 102
9,297
224,542 102
June 3, 2017
(1,000 eggs)
30,119 23,222
5,045 1,224 34,984 7,673 3,606 8,253 18,103 8,452
21,280 7,759 4,632 5,740
16,163 6,587
12,451
215,293 102
9,275
224,568 102
Broiler-Type Chicks Placed 19 Selected States and United States: 2017
State
April 29, 2017
May 6, 2017
Week ending
May 13, 2017
May 20, 2017
(1,000 chicks) (1,000 chicks) (1,000 chicks) (1,000 chicks)
Alabama ............................................. Arkansas ............................................ Delaware ............................................ Florida ................................................ Georgia .............................................. Kentucky ............................................. Louisiana ............................................ Maryland ............................................. Mississippi .......................................... Missouri ..............................................
21,713 21,886
6,223 1,427 27,216 6,119 3,267 5,433 15,399 5,646
22,386 20,508
6,166 1,191 27,228 6,433 3,273 5,467 14,880 5,689
21,203 21,384
5,957 1,344 29,331 6,115 3,294 5,586 15,046 6,331
21,890 20,964
5,141 1,320 27,219 5,905 3,175 6,952 15,454 5,697
May 27, 2017
(1,000 chicks)
22,394 23,382
6,124 1,253 27,311 5,504 3,275 5,727 15,312 5,870
June 3, 2017
(1,000 chicks)
22,131 22,852
5,506 1,323 27,880 5,857 3,231 6,522 15,013 5,749
North Carolina .................................... Oklahoma ........................................... Pennsylvania ...................................... South Carolina .................................... Texas ................................................. Virginia ............................................... California, Tennessee,
and West Virginia ..............................
17,455 4,938 3,718 4,734
13,181 5,487
11,038
17,672 5,114 3,862 4,502
12,950 5,845
10,305
17,167 3,896 3,760 4,529
13,336 5,762
10,878
16,760 5,046 3,663 5,207
13,191 5,739
10,150
17,322 3,000 3,737 5,322
12,981 5,540
11,214
17,276 3,562 3,499 4,888
13,115 5,729
10,227
19 State total ...................................... Percent of previous year .....................
174,880 102
173,471 102
174,919 102
173,473 101
175,268 101
174,360 101
Other States .......................................
6,776
7,003
7,134
7,058
7,323
6,901
United States ...................................... Percent of previous year .....................
181,656 102
180,474 102
182,053 102
180,531 101
182,591 102
181,261 101
Source: USDA National Agricultural Statistics Service, Broiler Hatchery, June 7, 2017. For additional information, the full report can be viewed at http://usda.mannlib.cornell.edu/MannUsda/viewDocumentInfo.do?documentID=1010
USDA is an equal opportunity provider and employer. All NASS reports are available, at no cost, on the NASS website: http://www.nass.usda.gov