- Collection:
- Georgia Government Publications
- Serial:
- Broiler hatchery news release / United States Department of Agriculture National Agricultural Statistics Service.
- Title:
- Southern region broiler hatchery news release [June 14, 2017]
- Creator:
- Georgia. Agricultural Statistics Service
- Contributor to Resource:
- Georgia. Agricultural Statistics Service
- Publisher:
- Athens, GA : Georgia. Agricultural Statistics Service
- Date of Original:
- 2017-06-14
- Subject:
- Georgia
- Location:
- United States, Georgia, 32.75042, -83.50018
- Medium:
- publications (documents)
- Type:
- Text
- Format:
- application/pdf
- Description:
- Began with: August 28, 2013.
Effective March 12, 2014, name of issuing body appears as Southern Regional Field Office.
August 28, 2013; title from caption (Georgia Government Publications database, viewed January 19, 2018).
January 17, 2018 (received via e-mail on January 18, 2018 from Georgia Department of Agriculture); (Georgia Government Publications database, viewed November 22, 2017). - External Identifiers:
- Call Number GA A400.C7 P1 H2 2017/6-14
- Metadata URL:
- https://dlg.galileo.usg.edu/id:dlg_ggpd_i-ga-ba400-pc7-bp1-bh2-b2017-s6-h14-belec-p-btext
- Digital Object URL:
- https://dlg.galileo.usg.edu/do:dlg_ggpd_i-ga-ba400-pc7-bp1-bh2-b2017-s6-h14-belec-p-btext
- Language:
- eng
- Holding Institution:
- University of Georgia. Map and Government Information Library
- Rights:
-

United States Department of Agriculture National Agricultural Statistics Service
Southern Region News Release Broiler Hatchery
Cooperating with the Alabama Department of Agriculture and Industries, Florida Department of Agriculture and Consumer Services, Georgia Department of Agriculture, and South Carolina Department of Agriculture
Southern Regional Field Office 355 East Hancock Avenue, Suite 100 Athens, GA 30601 (706) 546-2236 www.nass.usda.gov
June 14, 2017
Media Contact: Jim Ewing
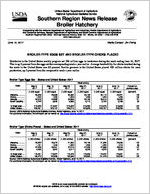
BROILER-TYPE EGGS SET AND BROILER-TYPE CHICKS PLACED
Hatcheries in the United States weekly program set 226 million eggs in incubators during the week ending June 14, 2017. This is up 3 percent from the eggs set the corresponding week a year earlier. Average hatchability for chicks hatched during the week in the United States was 83 percent. Broiler growers in the United States placed 183 million chicks for meat production, up 2 percent from the comparable week a year earlier.
Broiler-Type Eggs Set States and United States: 2017
State
Alabama ............. Florida ................ Georgia .............. South Carolina....
May 6, 2017
(1,000 eggs)
29,646 1,224
34,576 5,722
May 13, 2017
(1,000 eggs)
29,565 1,225
34,888 5,640
May 20, 2017
(1,000 eggs)
30,060 1,224
34,958 5,866
Week ending
May 27, 2017
(1,000 eggs)
30,156 1,225
35,155 5,710
June 3, 2017
(1,000 eggs)
30,119 1,224
35,015 5,723
June 10, 2017
(1,000 eggs)
30,221 1,225
35,259 5,766
Percent of previous year
(percent)
105 100 101
93
19 State total ......
213,925
214,307
215,642
215,263
215,379
216,808
102
United States ......
223,491
223,197
225,210
224,626
224,707
226,256
103
Source: USDA National Agricultural Statistics Service, Broiler Hatchery, June 14, 2017. For additional information, the full report can be viewed at http://usda.mannlib.cornell.edu/MannUsda/viewDocumentInfo.do?documentID=1010
Broiler-Type Chicks Placed States and United States: 2017
State
May 6, 2017
May 13, 2017
May 20, 2017
Week ending
May 27, 2017
(1,000 chicks) (1,000 chicks) (1,000 chicks) (1,000 chicks)
Alabama ............. Florida ................ Georgia .............. South Carolina....
22,082 1,191
27,228 4,498
20,973 1,344
29,331 4,547
21,890 1,320
27,219 5,217
22,126 1,253
27,338 5,348
June 3, 2017
(1,000 chicks)
21,828 1,323
27,966 4,879
June 10, 2017
(1,000 chicks)
22,099 1,319
29,044 5,305
Percent of previous year
(percent)
103 96
107 97
19 State total ......
173,451
174,927
173,478
175,326
174,570
175,681
101
United States ......
180,474
182,065
180,558
182,683
181,478
183,349
102
Source: USDA National Agricultural Statistics Service, Broiler Hatchery, June 14, 2017. For additional information, the full report can be viewed at http://usda.mannlib.cornell.edu/MannUsda/viewDocumentInfo.do?documentID=1010
USDA is an equal opportunity provider and employer. All NASS reports are available, at no cost, on the NASS website: http://www.nass.usda.gov
Broiler-Type Eggs Set 19 Selected States and United States: 2017
State
May 6, 2017
May 13, 2017
Week ending
May 20, 2017
May 27, 2017
(1,000 eggs)
(1,000 eggs)
(1,000 eggs)
(1,000 eggs)
Alabama ............................................. Arkansas ............................................ Delaware ............................................ Florida ................................................ Georgia .............................................. Kentucky ............................................. Louisiana ............................................ Maryland ............................................. Mississippi .......................................... Missouri ..............................................
29,646 23,811
4,825 1,224 34,576 7,215 3,637 8,225 18,303 7,916
29,565 23,867
4,755 1,225 34,888 7,421 3,591 8,188 18,029 7,897
30,060 23,635
5,009 1,224 34,958 7,483 3,592 8,256 18,134 8,238
30,156 23,132
5,026 1,225 35,155 7,561 3,606 8,244 18,164 8,020
North Carolina .................................... Oklahoma ........................................... Pennsylvania ...................................... South Carolina .................................... Texas ................................................. Virginia ............................................... California, Tennessee,
and West Virginia ..............................
22,199 7,511 4,545 5,722
16,006 6,557
12,007
22,320 7,362 4,636 5,640
16,135 6,587
12,201
22,467 7,140 4,589 5,866
16,210 6,535
12,246
22,082 7,401 4,722 5,710
16,251 6,585
12,223
19 State total ...................................... Percent of previous year .....................
213,925 102
214,307 102
215,642 102
215,263 102
Other States .......................................
9,566
8,890
9,568
9,363
United States ...................................... Percent of previous year .....................
223,491 103
223,197 103
225,210 102
224,626 102
June 3, 2017
(1,000 eggs)
30,119 23,261
5,045 1,224 35,015 7,673 3,606 8,253 18,103 8,452
21,280 7,759 4,694 5,723
16,163 6,556
12,453
215,379 102
9,328
224,707 102
June 10, 2017
(1,000 eggs)
30,221 23,584
5,071 1,225 35,259 7,619 3,531 8,224 18,344 8,370
22,385 7,493 4,625 5,766
16,227 6,562
12,302
216,808 102
9,448
226,256 103
Broiler-Type Chicks Placed 19 Selected States and United States: 2017
State
May 6, 2017
May 13, 2017
Week ending
May 20, 2017
May 27, 2017
(1,000 chicks) (1,000 chicks) (1,000 chicks) (1,000 chicks)
Alabama ............................................. Arkansas ............................................ Delaware ............................................ Florida ................................................ Georgia .............................................. Kentucky ............................................. Louisiana ............................................ Maryland ............................................. Mississippi .......................................... Missouri ..............................................
22,082 20,508
6,166 1,191 27,228 6,433 3,273 5,467 15,168 5,689
20,973 21,384
5,957 1,344 29,331 6,115 3,294 5,586 15,266 6,331
21,890 20,964
4,788 1,320 27,219 5,905 3,175 7,321 15,454 5,697
22,126 23,382
5,523 1,253 27,338 5,504 3,275 6,219 15,581 5,870
June 3, 2017
(1,000 chicks)
21,828 22,769
4,979 1,323 27,966 5,858 3,231 7,075 15,345 5,877
June 10, 2017
(1,000 chicks)
22,099 19,980
5,276 1,319 29,044 5,606 3,123 6,412 15,404 6,665
North Carolina .................................... Oklahoma ........................................... Pennsylvania ...................................... South Carolina .................................... Texas ................................................. Virginia ............................................... California, Tennessee,
and West Virginia ..............................
17,672 5,114 3,862 4,498
12,950 5,845
10,305
17,167 3,896 3,760 4,547
13,336 5,762
10,878
16,760 5,046 3,663 5,217
13,191 5,718
10,150
17,322 3,000 3,737 5,348
12,981 5,653
11,214
17,254 3,606 3,660 4,879
12,973 5,692
10,255
16,809 5,306 3,713 5,305
13,334 5,394
10,892
19 State total ...................................... Percent of previous year .....................
173,451 102
174,927 102
173,478 101
175,326 101
174,570 101
175,681 101
Other States .......................................
7,003
7,138
7,080
7,357
6,908
7,668
United States ...................................... Percent of previous year .....................
180,454 102
182,065 102
180,558 101
182,683 102
181,478 101
183,349 102
Source: USDA National Agricultural Statistics Service, Broiler Hatchery, June 14, 2017. For additional information, the full report can be viewed at http://usda.mannlib.cornell.edu/MannUsda/viewDocumentInfo.do?documentID=1010
USDA is an equal opportunity provider and employer. All NASS reports are available, at no cost, on the NASS website: http://www.nass.usda.gov