- Collection:
- Georgia Government Publications
- Serial:
- Broiler hatchery news release / United States Department of Agriculture National Agricultural Statistics Service.
- Title:
- Southern region broiler hatchery news release [May 17, 2017]
- Creator:
- Georgia. Agricultural Statistics Service
- Contributor to Resource:
- Georgia. Agricultural Statistics Service
- Publisher:
- Athens, GA : Georgia. Agricultural Statistics Service
- Date of Original:
- 2017-05-17
- Subject:
- Georgia
- Location:
- United States, Georgia, 32.75042, -83.50018
- Medium:
- publications (documents)
- Type:
- Text
- Format:
- application/pdf
- Description:
- Began with: August 28, 2013.
Effective March 12, 2014, name of issuing body appears as Southern Regional Field Office.
August 28, 2013; title from caption (Georgia Government Publications database, viewed January 19, 2018).
January 17, 2018 (received via e-mail on January 18, 2018 from Georgia Department of Agriculture); (Georgia Government Publications database, viewed November 22, 2017). - External Identifiers:
- Call Number GA A400.C7 P1 H2 2017/5-17
- Metadata URL:
- https://dlg.galileo.usg.edu/id:dlg_ggpd_i-ga-ba400-pc7-bp1-bh2-b2017-s5-h17-belec-p-btext
- Digital Object URL:
- https://dlg.galileo.usg.edu/do:dlg_ggpd_i-ga-ba400-pc7-bp1-bh2-b2017-s5-h17-belec-p-btext
- Language:
- eng
- Holding Institution:
- University of Georgia. Map and Government Information Library
- Rights:
-

United States Department of Agriculture National Agricultural Statistics Service
Southern Region News Release Broiler Hatchery
Cooperating with the Alabama Department of Agriculture and Industries, Florida Department of Agriculture and Consumer Services, Georgia Department of Agriculture, and South Carolina Department of Agriculture
Southern Regional Field Office 355 East Hancock Avenue, Suite 100 Athens, GA 30601 (706) 546-2236 www.nass.usda.gov
May 17, 2017
Media Contact: Jim Ewing
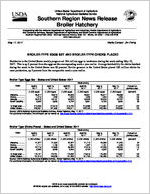
BROILER-TYPE EGGS SET AND BROILER-TYPE CHICKS PLACED
Hatcheries in the United States weekly program set 224 million eggs in incubators during the week ending May 13, 2017. This is up 3 percent from the eggs set the corresponding week a year earlier. Average hatchability for chicks hatched during the week in the United States was 83 percent. Broiler growers in the United States placed 182 million chicks for meat production, up 2 percent from the comparable week a year earlier.
Broiler-Type Eggs Set States and United States: 2017
State
Alabama ............. Florida ................ Georgia .............. South Carolina....
April 8, 2017
(1,000 eggs)
29,617 1,210
34,218 5,639
April 15, 2017
(1,000 eggs)
29,810 1,223
34,151 5,655
April 22, 2017
(1,000 eggs)
29,643 1,223
34,679 5,732
Week ending
April 29, 2017
(1,000 eggs)
29,601 1,223
33,924 5,681
May 6, 2017
(1,000 eggs)
29,617 1,224
34,576 5,708
May 13, 2017
(1,000 eggs)
29,696 1,225
34,797 5,650
Percent of previous year
(percent)
100 100 100
98
19 State total ......
214,239
212,418
213,743
213,268
213,967
214,327
102
United States ......
223,051
221,630
223,011
222,704
223,483
223,599
103
Source: USDA National Agricultural Statistics Service, Broiler Hatchery, May 17, 2017. For additional information, the full report can be viewed at http://usda.mannlib.cornell.edu/MannUsda/viewDocumentInfo.do?documentID=1010
Broiler-Type Chicks Placed States and United States: 2017
State
April 8, 2017
April 15, 2017
April 22, 2017
Week ending
April 29, 2017
(1,000 chicks) (1,000 chicks) (1,000 chicks) (1,000 chicks)
Alabama ............. Florida ................ Georgia .............. South Carolina....
21,877 1,111
27,715 6,085
21,594 1,180
27,658 5,206
22,427 1,391
26,422 5,264
21,713 1,427
27,216 4,734
May 6, 2017
(1,000 chicks)
22,386 1,191
27,228 4,502
May 13, 2017
(1,000 chicks)
21,203 1,345
29,320 4,528
Percent of previous year
(percent)
94 104 110
91
19 State total ......
174,121
172,781
174,282
174,918
173,452
174,607
102
United States ......
181,514
180,058
181,453
181,703
180,468
181,721
102
Source: USDA National Agricultural Statistics Service, Broiler Hatchery, May 17, 2017. For additional information, the full report can be viewed at http://usda.mannlib.cornell.edu/MannUsda/viewDocumentInfo.do?documentID=1010
USDA is an equal opportunity provider and employer. All NASS reports are available, at no cost, on the NASS website: http://www.nass.usda.gov
Broiler-Type Eggs Set 19 Selected States and United States: 2017
State
April 8, 2017
April 15, 2017
Week ending
April 22, 2017
April 29, 2017
(1,000 eggs)
(1,000 eggs)
(1,000 eggs)
(1,000 eggs)
Alabama ............................................ Arkansas ............................................ Delaware ............................................ Florida ............................................... Georgia .............................................. Kentucky ............................................. Louisiana ............................................ Maryland ............................................. Mississippi .......................................... Missouri ..............................................
29,617 24,261
4,872 1,210 34,218 7,514 3,727 8,215 18,031 8,123
29,810 23,065
4,861 1,223 34,151 7,342 3,743 8,255 17,822 8,172
29,643 23,285
4,887 1,223 34,679 7,391 3,727 8,252 18,003 8,166
29,601 23,322
4,980 1,223 33,924 7,310 3,530 8,261 18,154 7,879
North Carolina .................................... Oklahoma ........................................... Pennsylvania ...................................... South Carolina .................................. Texas ................................................. Virginia ............................................... California, Tennessee,
and West Virginia ..............................
22,157 7,295 4,855 5,639
15,783 6,557
12,165
21,771 7,003 4,856 5,655
15,612 6,557
12,520
22,022 7,305 4,592 5,732
15,972 6,573
12,291
21,948 7,535 4,677 5,681
15,939 6,660
12,644
19 State total ...................................... Percent of previous year .....................
214,239 103
212,418 102
213,743 102
213,268 103
Other States .......................................
8,812
9,212
9,268
9,436
United States ...................................... Percent of previous year .....................
223,051 103
221,630 103
223,011 103
222,704 103
May 6, 2017
(1,000 eggs)
29,617 23,713
4,825 1,224 34,576 7,215 3,637 8,225 18,303 7,916
22,199 7,511 4,468 5,708
16,006 6,557
12,267
213,967 102
9,516
223,483 103
May 13, 2017
(1,000 eggs)
29,696 23,878
4,755 1,225 34,797 7,421 3,591 8,187 18,029 7,897
22,305 7,362 4,513 5,650
16,060 6,587
12,374
214,327 102
9,272
223,599 103
Broiler-Type Chicks Placed 19 Selected States and United States: 2017
State
April 8, 2017
April 15, 2017
Week ending
April 22, 2017
April 29, 2017
(1,000 chicks) (1,000 chicks) (1,000 chicks) (1,000 chicks)
Alabama ............................................ Arkansas ............................................ Delaware ............................................ Florida ............................................... Georgia .............................................. Kentucky ............................................. Louisiana ............................................ Maryland ............................................. Mississippi .......................................... Missouri ..............................................
21,877 23,540
5,312 1,111 27,715 5,879 3,329 6,438 15,317 5,105
21,594 21,834
5,323 1,180 27,658 6,194 3,028 5,701 15,230 6,378
22,427 22,587
5,715 1,391 26,422 6,166 3,320 6,200 15,271 5,336
21,713 21,886
6,223 1,427 27,216 6,119 3,267 5,434 15,399 5,646
May 6, 2017
(1,000 chicks)
22,386 20,508
6,166 1,191 27,228 6,433 3,273 5,468 14,880 5,689
May 13, 2017
(1,000 chicks)
21,203 21,415
5,631 1,345 29,320 6,108 3,294 5,942 15,044 6,312
North Carolina .................................... Oklahoma ........................................... Pennsylvania ...................................... South Carolina .................................. Texas ................................................. Virginia ............................................... California, Tennessee,
and West Virginia ..............................
15,956 2,994 3,763 6,085
13,172 5,671
10,857
16,871 3,750 3,726 5,206
13,058 5,979
10,071
17,200 4,354 3,464 5,264
13,036 5,533
10,596
17,455 4,938 3,768 4,734
13,181 5,447
11,065
17,672 5,114 3,836 4,502
12,950 5,815
10,341
17,012 3,896 3,688 4,528
13,336 5,715
10,818
19 State total ...................................... Percent of previous year .....................
174,121 101
172,781 102
174,282 102
174,918 102
173,452 102
174,607 102
Other States .......................................
7,393
7,277
7,171
6,785
7,016
7,114
United States ...................................... Percent of previous year .....................
181,514 101
180,058 102
181,453 102
181,703 102
180,468 102
181,721 102
Source: USDA National Agricultural Statistics Service, Broiler Hatchery, May 17, 2017. For additional information, the full report can be viewed at http://usda.mannlib.cornell.edu/MannUsda/viewDocumentInfo.do?documentID=1010
USDA is an equal opportunity provider and employer. All NASS reports are available, at no cost, on the NASS website: http://www.nass.usda.gov