- Collection:
- Georgia Government Publications
- Serial:
- Broiler hatchery news release / United States Department of Agriculture National Agricultural Statistics Service.
- Title:
- Southern region broiler hatchery news release [Mar. 8, 2017]
- Creator:
- Georgia. Agricultural Statistics Service
- Contributor to Resource:
- Georgia. Agricultural Statistics Service
- Publisher:
- Athens, GA : Georgia. Agricultural Statistics Service
- Date of Original:
- 2017-03-08
- Subject:
- Georgia
- Location:
- United States, Georgia, 32.75042, -83.50018
- Medium:
- publications (documents)
- Type:
- Text
- Format:
- application/pdf
- Description:
- Began with: August 28, 2013.
Effective March 12, 2014, name of issuing body appears as Southern Regional Field Office.
August 28, 2013; title from caption (Georgia Government Publications database, viewed January 19, 2018).
January 17, 2018 (received via e-mail on January 18, 2018 from Georgia Department of Agriculture); (Georgia Government Publications database, viewed November 22, 2017). - External Identifiers:
- Call Number GA A400.C7 P1 H2 2017/3-8
- Metadata URL:
- https://dlg.galileo.usg.edu/id:dlg_ggpd_i-ga-ba400-pc7-bp1-bh2-b2017-s3-h8-belec-p-btext
- Digital Object URL:
- https://dlg.galileo.usg.edu/do:dlg_ggpd_i-ga-ba400-pc7-bp1-bh2-b2017-s3-h8-belec-p-btext
- Language:
- eng
- Holding Institution:
- University of Georgia. Map and Government Information Library
- Rights:
-

United States Department of Agriculture National Agricultural Statistics Service
Southern Region News Release Broiler Hatchery
Cooperating with the Alabama Department of Agriculture and Industries, Florida Department of Agriculture and Consumer Services, Georgia Department of Agriculture, and South Carolina Department of Agriculture
Southern Regional Field Office 355 East Hancock Avenue, Suite 100 Athens, GA 30601 (706) 546-2236 www.nass.usda.gov
March 8, 2017
Media Contact: Jim Ewing
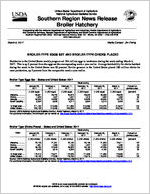
BROILER-TYPE EGGS SET AND BROILER-TYPE CHICKS PLACED
Hatcheries in the United States weekly program set 224 million eggs in incubators during the week ending March 4, 2017. This is up 3 percent from the eggs set the corresponding week a year earlier. Average hatchability for chicks hatched during the week in the United States was 83 percent. Broiler growers in the United States placed 180 million chicks for meat production, up 2 percent from the comparable week a year earlier.
Broiler-Type Eggs Set States and United States: 2017
State
Alabama ............. Florida ................ Georgia .............. South Carolina....
January 28, 2017
(1,000 eggs)
29,901 1,034
34,344 5,332
February 4, 2017
(1,000 eggs)
29,720 1,007
34,292 5,328
February 11, 2017
(1,000 eggs)
29,974 1,037
34,949 5,317
Week ending
February 18, 2017
(1,000 eggs)
29,543 1,019
34,528 5,554
February 25, 2017
(1,000 eggs)
29,568 1,052
34,943 5,319
March 4, 2017
(1,000 eggs)
29,543 1,090
34,779 5,484
Percent of previous year
(percent)
103 90
101 100
19 State total ......
211,180
210,495
211,885
213,499
213,279
214,877
103
United States ......
220,188
219,435
220,836
222,526
222,206
223,760
103
Source: USDA National Agricultural Statistics Service, Broiler Hatchery, March 8, 2017. For additional information, the full report can be viewed at http://usda.mannlib.cornell.edu/MannUsda/viewDocumentInfo.do?documentID=1010
Broiler-Type Chicks Placed States and United States: 2017
State
January 28, 2017
February 4, 2017
February 11, 2017
Week ending
February 18, 2017
(1,000 chicks) (1,000 chicks) (1,000 chicks) (1,000 chicks)
Alabama ............. Florida ................ Georgia .............. South Carolina....
22,135 1,351
26,730 5,295
21,391 1,260
27,844 5,318
22,169 1,190
26,823 6,095
23,106 1,327
26,199 4,909
February 25, 2017
(1,000 chicks)
21,595 1,230
27,238 4,160
March 4, 2017
(1,000 chicks)
22,011 1,080
28,679 4,058
Percent of previous year
(percent)
102 94
102 82
19 State total ......
172,410
170,071
172,225
171,938
171,389
172,605
101
United States ......
179,109
177,088
178,795
179,019
178,542
179,848
102
Source: USDA National Agricultural Statistics Service, Broiler Hatchery, March 8, 2017. For additional information, the full report can be viewed at http://usda.mannlib.cornell.edu/MannUsda/viewDocumentInfo.do?documentID=1010
USDA is an equal opportunity provider and employer. All NASS reports are available, at no cost, on the NASS website: http://www.nass.usda.gov
Broiler-Type Eggs Set 19 Selected States and United States: 2017
State
January 28, 2017
February 4, 2017
Week ending
February 11, 2017
February 18, 2017
(1,000 eggs)
(1,000 eggs)
(1,000 eggs)
(1,000 eggs)
Alabama ............................................. Arkansas ............................................ Delaware ............................................ Florida ................................................ Georgia .............................................. Kentucky ............................................. Louisiana ............................................ Maryland ............................................. Mississippi .......................................... Missouri ..............................................
29,901 22,751
4,977 1,034 34,344 7,775 2,350 8,198 17,457 8,086
29,720 23,376
4,924 1,007 34,292 8,000 2,744 8,217 16,990 8,152
29,974 22,947
4,910 1,037 34,949 7,742 3,682 7,692 17,523 8,152
29,543 23,652
4,924 1,019 34,528 7,598 3,772 8,211 17,605 8,273
North Carolina .................................... Oklahoma ........................................... Pennsylvania ...................................... South Carolina .................................... Texas ................................................. Virginia ............................................... California, Tennessee,
and West Virginia ..............................
21,814 7,665 4,852 5,332
16,032 6,519
12,093
21,378 7,790 4,695 5,328
15,806 6,519
11,557
21,270 7,641 4,434 5,317
16,019 6,543
12,053
21,966 7,750 4,302 5,554
15,801 6,538
12,463
19 State total ...................................... Percent of previous year .....................
211,180 101
210,495 102
211,885 102
213,499 103
Other States .......................................
9,008
8,940
8,951
9,027
United States ...................................... Percent of previous year .....................
220,188 102
219,435 102
220,836 102
222,526 103
February 25, 2017
(1,000 eggs)
29,568 23,606
4,851 1,052 34,943 7,232 3,742 8,215 17,697 8,273
21,480 7,707 4,870 5,319
15,982 6,505
12,237
213,279 102
8,927
222,206 102
March 4, 2017
(1,000 eggs)
29,543 24,133
4,921 1,090 34,779 7,541 3,769 8,216 17,805 8,245
22,030 7,648 4,662 5,484
15,918 6,553
12,540
214,877 103
8,883
223,760 103
Broiler-Type Chicks Placed 19 Selected States and United States: 2017
State
January 28, 2017
February 4, 2017
Week ending
February 11, 2017
February 18, 2017
(1,000 chicks) (1,000 chicks) (1,000 chicks) (1,000 chicks)
Alabama ............................................. Arkansas ............................................ Delaware ............................................ Florida ................................................ Georgia .............................................. Kentucky ............................................. Louisiana ............................................ Maryland ............................................. Mississippi .......................................... Missouri ..............................................
22,135 21,336
5,223 1,351 26,730 6,068 3,057 6,575 15,146 6,654
21,391 20,502
5,407 1,260 27,844 6,000 3,085 5,965 14,978 5,577
22,169 22,738
6,087 1,190 26,823 6,273 3,197 5,630 14,368 5,367
23,106 21,078
6,618 1,327 26,199 6,511 2,107 4,924 15,059 6,219
February 25, 2017
(1,000 chicks)
21,595 21,113
5,577 1,230 27,238 5,976 2,441 6,207 14,553 5,581
March 4, 2017
(1,000 chicks)
22,011 21,300
5,221 1,080 28,679 6,009 3,234 5,883 14,884 5,537
North Carolina .................................... Oklahoma ........................................... Pennsylvania ...................................... South Carolina .................................... Texas ................................................. Virginia ............................................... California, Tennessee,
and West Virginia ..............................
16,673 3,319 3,598 5,295
12,986 5,490
10,774
16,233 3,770 3,541 5,318
13,185 5,755
10,260
16,197 3,297 3,755 6,095
12,861 5,368
10,810
17,073 3,785 3,701 4,909
13,145 5,742
10,435
17,369 5,306 3,709 4,160
13,144 5,526
10,664
17,051 4,641 3,387 4,058
13,497 5,310
10,823
19 State total ...................................... Percent of previous year .....................
172,410 101
170,071 100
172,225 101
171,938 101
171,389 101
172,605 101
Other States .......................................
6,699
7,017
6,570
7,081
7,153
7,243
United States ...................................... Percent of previous year .....................
179,109 101
177,088 101
178,795 101
179,019 101
178,542 101
179,848 102
Source: USDA National Agricultural Statistics Service, Broiler Hatchery, March 8, 2017. For additional information, the full report can be viewed at http://usda.mannlib.cornell.edu/MannUsda/viewDocumentInfo.do?documentID=1010
USDA is an equal opportunity provider and employer. All NASS reports are available, at no cost, on the NASS website: http://www.nass.usda.gov