- Collection:
- Georgia Government Publications
- Serial:
- Broiler hatchery news release / United States Department of Agriculture National Agricultural Statistics Service.
- Title:
- Southern region broiler hatchery news release [Feb. 15, 2017]
- Creator:
- Georgia. Agricultural Statistics Service
- Contributor to Resource:
- Georgia. Agricultural Statistics Service
- Publisher:
- Athens, GA : Georgia. Agricultural Statistics Service
- Date of Original:
- 2017-02-15
- Subject:
- Georgia
- Location:
- United States, Georgia, 32.75042, -83.50018
- Medium:
- publications (documents)
- Type:
- Text
- Format:
- application/pdf
- Description:
- Began with: August 28, 2013.
Effective March 12, 2014, name of issuing body appears as Southern Regional Field Office.
August 28, 2013; title from caption (Georgia Government Publications database, viewed January 19, 2018).
January 17, 2018 (received via e-mail on January 18, 2018 from Georgia Department of Agriculture); (Georgia Government Publications database, viewed November 22, 2017). - External Identifiers:
- Call Number GA A400.C7 P1 H2 2017/2-15
- Metadata URL:
- https://dlg.galileo.usg.edu/id:dlg_ggpd_i-ga-ba400-pc7-bp1-bh2-b2017-s2-h15-belec-p-btext
- Digital Object URL:
- https://dlg.galileo.usg.edu/do:dlg_ggpd_i-ga-ba400-pc7-bp1-bh2-b2017-s2-h15-belec-p-btext
- Language:
- eng
- Holding Institution:
- University of Georgia. Map and Government Information Library
- Rights:
-

United States Department of Agriculture National Agricultural Statistics Service
Southern Region News Release Broiler Hatchery
Cooperating with the Alabama Department of Agriculture and Industries, Florida Department of Agriculture and Consumer Services, Georgia Department of Agriculture, and South Carolina Department of Agriculture
Southern Regional Field Office 355 East Hancock Avenue, Suite 100 Athens, GA 30601 (706) 546-2236 www.nass.usda.gov
February 15, 2017
Media Contact: Jim Ewing
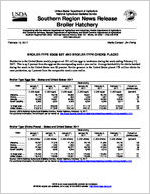
BROILER-TYPE EGGS SET AND BROILER-TYPE CHICKS PLACED
Hatcheries in the United States weekly program set 221 million eggs in incubators during the week ending February 11, 2017. This is up 2 percent from the eggs set the corresponding week a year earlier. Average hatchability for chicks hatched during the week in the United States was 83 percent. Broiler growers in the United States placed 179 million chicks for meat production, up 1 percent from the comparable week a year earlier.
Broiler-Type Eggs Set States and United States: 2017
State
Alabama ............. Florida ................ Georgia .............. South Carolina....
January 7, 2017
(1,000 eggs)
29,775 1,175
34,086 5,655
January 14, 2017
(1,000 eggs)
29,745 1,022
34,601 5,357
January 21, 2017
(1,000 eggs)
29,860 954
34,560 5,406
Week ending
January 28, 2017
(1,000 eggs)
29,901 1,034
34,344 5,332
February 4, 2017
(1,000 eggs)
29,735 1,007
34,292 5,328
February 11, 2017
(1,000 eggs)
29,858 1,037
34,949 5,317
Percent of previous year
(percent)
101 85
101 95
19 State total ......
211,212
209,003
211,171
211,173
210,510
212,316
102
United States ......
219,915
217,842
220,163
220,161
219,480
221,282
102
Source: USDA National Agricultural Statistics Service, Broiler Hatchery, February 15, 2017. For additional information, the full report can be viewed at http://usda.mannlib.cornell.edu/MannUsda/viewDocumentInfo.do?documentID=1010
Broiler-Type Chicks Placed States and United States: 2017
State
January 7, 2017
January 14, 2017
January 21, 2017
Week ending
January 28, 2017
(1,000 chicks) (1,000 chicks) (1,000 chicks) (1,000 chicks)
Alabama ............. Florida ................ Georgia .............. South Carolina....
22,267 1,377
27,464 4,623
21,043 1,203
27,883 4,646
21,753 1,283
26,277 4,836
22,125 1,351
26,730 5,295
February 4, 2017
(1,000 chicks)
21,650 1,260
27,844 5,318
February 11, 2017
(1,000 chicks)
22,153 1,190
26,810 6,094
Percent of previous year
(percent)
106 104
96 123
19 State total ......
172,440
171,776
172,737
172,400
170,093
172,117
101
United States ......
179,418
178,295
179,507
179,099
177,110
178,683
101
Source: USDA National Agricultural Statistics Service, Broiler Hatchery, February 15, 2017. For additional information, the full report can be viewed at http://usda.mannlib.cornell.edu/MannUsda/viewDocumentInfo.do?documentID=1010
USDA is an equal opportunity provider and employer. All NASS reports are available, at no cost, on the NASS website: http://www.nass.usda.gov
Broiler-Type Eggs Set 19 Selected States and United States: 2017
State
January 7, 2017
January 14, 2017
Week ending
January 21, 2017
January 28, 2017
(1,000 eggs)
(1,000 eggs)
(1,000 eggs)
(1,000 eggs)
Alabama ............................................ Arkansas ............................................ Delaware ............................................ Florida ............................................... Georgia .............................................. Kentucky ............................................. Louisiana ............................................ Maryland ............................................. Mississippi .......................................... Missouri ..............................................
29,775 22,413
5,089 1,175 34,086 7,245 3,348 8,193 17,495 8,101
29,745 20,821
4,893 1,022 34,601 7,390 3,439 8,190 17,390 8,105
29,860 22,716
4,859 954
34,560 7,582 3,651 8,185
16,988 7,916
29,901 22,751
4,977 1,034 34,344 7,775 2,350 8,198 17,457 8,086
North Carolina .................................... Oklahoma ........................................... Pennsylvania ...................................... South Carolina .................................. Texas ................................................. Virginia ............................................... California, Tennessee,
and West Virginia ..............................
21,488 7,737 4,539 5,655
16,025 6,513
12,335
21,626 7,637 4,492 5,357
16,042 6,512
11,741
21,347 7,763 4,558 5,406
15,798 6,503
12,525
21,814 7,665 4,865 5,332
16,032 6,519
12,073
19 State total ...................................... Percent of previous year .....................
211,212 102
209,003 100
211,171 101
211,173 101
Other States .......................................
8,703
8,839
8,992
8,988
United States ...................................... Percent of previous year .....................
219,915 102
217,842 101
220,163 102
220,161 102
February 4, 2017
(1,000 eggs)
29,735 23,376
4,924 1,007 34,292 8,000 2,744 8,217 16,990 8,152
21,378 7,790 4,695 5,328
15,806 6,519
11,557
210,510 102
8,970
219,480 102
February 11, 2017
(1,000 eggs)
29,858 23,090
4,910 1,037 34,949 8,059 3,682 7,670 17,523 8,152
21,345 7,641 4,548 5,317
16,081 6,543
11,911
212,316 102
8,966
221,282 102
Broiler-Type Chicks Placed 19 Selected States and United States: 2017
State
January 7, 2017
January 14, 2017
Week ending
January 21, 2017
January 28, 2017
(1,000 chicks) (1,000 chicks) (1,000 chicks) (1,000 chicks)
Alabama ............................................ Arkansas ............................................ Delaware ............................................ Florida ............................................... Georgia .............................................. Kentucky ............................................. Louisiana ............................................ Maryland ............................................. Mississippi .......................................... Missouri ..............................................
22,267 21,308
6,129 1,377 27,464 5,681 3,262 5,584 14,746 5,901
21,043 19,909
5,982 1,203 27,883 5,639 3,324 5,926 15,001 5,876
21,753 22,424
5,278 1,283 26,277 5,640 3,275 6,173 15,307 5,544
22,125 21,336
5,223 1,351 26,730 6,068 3,057 6,575 15,146 6,654
February 4, 2017
(1,000 chicks)
21,650 20,502
5,407 1,260 27,844 6,000 3,085 5,965 14,741 5,577
February 11, 2017
(1,000 chicks)
22,153 22,739
5,733 1,190 26,810 6,223 3,197 5,926 14,368 5,367
North Carolina .................................... Oklahoma ........................................... Pennsylvania ...................................... South Carolina .................................. Texas ................................................. Virginia ............................................... California, Tennessee,
and West Virginia ..............................
16,744 4,333 3,795 4,623
13,208 5,609
10,409
16,745 5,412 3,698 4,646
12,796 5,305
11,388
17,067 3,691 3,666 4,836
12,885 6,054
11,584
16,673 3,319 3,598 5,295
12,986 5,490
10,774
16,233 3,770 3,541 5,318
13,185 5,755
10,260
16,228 3,297 3,672 6,094
12,879 5,418
10,823
19 State total ...................................... Percent of previous year .....................
172,440 101
171,776 101
172,737 103
172,400 101
170,093 100
172,117 101
Other States .......................................
6,978
6,519
6,770
6,699
7,017
6,566
United States ...................................... Percent of previous year .....................
179,418 101
178,295 101
179,507 103
179,099 101
177,110 101
178,683 101
Source: USDA National Agricultural Statistics Service, Broiler Hatchery, February 15, 2017. For additional information, the full report can be viewed at http://usda.mannlib.cornell.edu/MannUsda/viewDocumentInfo.do?documentID=1010
USDA is an equal opportunity provider and employer. All NASS reports are available, at no cost, on the NASS website: http://www.nass.usda.gov