- Collection:
- Georgia Government Publications
- Serial:
- Broiler hatchery news release / United States Department of Agriculture National Agricultural Statistics Service.
- Title:
- Georgia weekly hatchery, 2017 December 28
- Creator:
- Georgia Agricultural Statistics Service
- Contributor to Resource:
- Georgia. Agricultural Statistics Service
- Publisher:
- Athens, Ga. : Georgia Agricultural Statistics Service
- Date of Original:
- 2017-12-28
- Subject:
- Poultry--Hatcheries--Georgia--Statistics--Periodicals
Eggs--Production--Georgia--Statistics--Periodicals - Location:
- United States, Georgia, 32.75042, -83.50018
- Medium:
- serials (publications)
- Type:
- Text
- Format:
- application/pdf
- Description:
- This news release contains Georgia agricultural statistics. Issue for Jan. 10, 2007 has title: News release. Issues for Jan. 17, 2007- have title: GA weekly hatchery news release. Issues for June 2007- have title: GA broiler hatchery news release. Also published under the title "ga-broilers weekly hatchery report."
- External Identifiers:
- Call Number GA A400.C7 P1 H2 2017/12-28
- Metadata URL:
- https://dlg.galileo.usg.edu/id:dlg_ggpd_i-ga-ba400-pc7-bp1-bh2-b2017-s12-h28-belec-p-btext
- Digital Object URL:
- https://dlg.galileo.usg.edu/do:dlg_ggpd_i-ga-ba400-pc7-bp1-bh2-b2017-s12-h28-belec-p-btext
- Language:
- eng
- Holding Institution:
- University of Georgia. Map and Government Information Library
- Rights:
-

United States Department of Agriculture National Agricultural Statistics Service
Southern Region News Release Broiler Hatchery
Cooperating with the Alabama Department of Agriculture and Industries, Florida Department of Agriculture and Consumer Services, Georgia Department of Agriculture, and South Carolina Department of Agriculture
Southern Regional Field Office 355 East Hancock Avenue, Suite 100 Athens, GA 30601 (706) 546-2236 www.nass.usda.gov
December 28, 2017
Media Contact: Jim Ewing
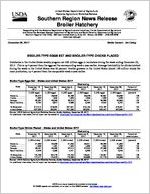
BROILER-TYPE EGGS SET AND BROILER-TYPE CHICKS PLACED
Hatcheries in the United States weekly program set 228 million eggs in incubators during the week ending December 23, 2017. This is up 4 percent from the eggs set the corresponding week a year earlier. Average hatchability for chicks hatched during the week in the United States was 82 percent. Broiler growers in the United States placed 186 million chicks for meat production, up 4 percent from the comparable week a year earlier.
Broiler-Type Eggs Set States and United States: 2017
State
Alabama ............. Florida ................ Georgia .............. South Carolina....
November 18, 2017
(1,000 eggs)
30,274 1,223
35,034 5,734
November 25, 2017
(1,000 eggs)
29,909 1,224
35,099 5,617
December 2, 2017
(1,000 eggs)
30,763 1,225
35,616 5,865
Week ending
December 9, 2017
(1,000 eggs)
29,876 1,225
34,411 5,494
December 16, 2017
(1,000 eggs)
30,651 1,225
35,369 5,544
December 23, 2017
(1,000 eggs)
30,392 1,223
34,648 5,757
Percent of previous year
(percent)
103 101 100 104
19 State total ......
217,414
216,084
221,541
212,154
219,167
218,431
104
United States ......
227,035
225,351
231,055
220,961
228,457
227,532
104
Source: USDA National Agricultural Statistics Service, Broiler Hatchery, December 28, 2017. For additional information, the full report can be viewed at http://usda.mannlib.cornell.edu/MannUsda/viewDocumentInfo.do?documentID=1010
Broiler-Type Chicks Placed States and United States: 2017
Week ending
State
November 18, 2017
November 25, 2017
December 2, 2017
December 9, 2017
(1,000 chicks) (1,000 chicks) (1,000 chicks) (1,000 chicks)
Alabama ............. Florida ................ Georgia .............. South Carolina....
21,298 1,582
26,481 5,245
20,259 1,461
25,822 4,898
21,280 1,430
27,014 4,441
22,941 1,532
27,004 5,263
December 16, 2017
(1,000 chicks)
22,038 1,254
27,468 4,149
December 23, 2017
(1,000 chicks)
21,554 1,392
29,080 4,943
Percent of previous year
(percent)
96 104 106 110
19 State total ......
170,736
167,776
170,730
176,421
175,091
178,241
103
United States ......
177,477
174,878
178,055
183,663
181,779
185,565
104
Source: USDA National Agricultural Statistics Service, Broiler Hatchery, December 28, 2017. For additional information, the full report can be viewed at http://usda.mannlib.cornell.edu/MannUsda/viewDocumentInfo.do?documentID=1010
USDA is an equal opportunity provider and employer. All NASS reports are available, at no cost, on the NASS website: http://www.nass.usda.gov
Broiler-Type Eggs Set 19 Selected States and United States: 2017
State
November 18, November 25,
2017
2017
Week ending
December 2, 2017
December 9, 2017
(1,000 eggs)
(1,000 eggs)
(1,000 eggs)
(1,000 eggs)
Alabama ............................................ Arkansas ............................................ Delaware ............................................ Florida ............................................... Georgia .............................................. Kentucky ............................................. Louisiana ............................................ Maryland ............................................. Mississippi .......................................... Missouri ..............................................
30,274 23,709
4,890 1,223 35,034 7,854 3,772 8,259 18,527 8,319
29,909 23,859
4,916 1,224 35,099 7,080 3,591 8,254 18,405 8,319
30,763 23,860
4,913 1,225 35,616 7,977 4,029 8,256 18,451 8,317
29,876 23,718
4,916 1,225 34,411 7,709 2,926 8,249 18,663 8,316
December 16, 2017
(1,000 eggs)
30,651 24,149
4,916 1,225 35,369 7,993 3,591 8,253 18,544 8,201
December 23, 2017
(1,000 eggs)
30,392 23,994
4,916 1,223 34,648 8,017 3,591 8,240 18,499 8,193
North Carolina .................................... Oklahoma ........................................... Pennsylvania ...................................... South Carolina .................................. Texas ................................................. Virginia ............................................... California, Tennessee,
and West Virginia ..............................
22,041 7,560 5,535 5,734
16,143 6,549
11,991
21,906 7,718 5,584 5,617
16,085 6,452
12,066
23,130 7,611 5,545 5,865
16,613 6,785
12,585
20,893 7,609 5,270 5,494
15,534 6,289
11,056
22,871 7,616 5,395 5,544
16,071 6,602
12,176
22,599 7,656 5,466 5,757
16,275 6,630
12,335
19 State total ...................................... Percent of previous year .....................
217,414 103
216,084 102
221,541 105
212,154 101
219,167 103
218,431 104
Other States .......................................
9,621
9,267
9,514
8,807
9,290
9,101
United States ...................................... Percent of previous year .....................
227,035 103
225,351 102
231,055 105
220,961 101
228,457 103
227,532 104
Broiler-Type Chicks Placed 19 Selected States and United States: 2017
State
November 18, November 25,
2017
2017
Week ending
December 2, 2017
December 9, 2017
(1,000 chicks) (1,000 chicks) (1,000 chicks) (1,000 chicks)
Alabama ............................................ Arkansas ............................................ Delaware ............................................ Florida ............................................... Georgia .............................................. Kentucky ............................................. Louisiana ............................................ Maryland ............................................. Mississippi .......................................... Missouri ..............................................
21,298 21,137
5,703 1,582 26,481 5,720 3,272 6,098 14,902 5,315
20,259 22,396
4,490 1,461 25,822 5,959 2,747 7,428 14,387 5,397
21,280 21,916
5,757 1,430 27,014 6,411 2,689 4,995 14,881 5,889
22,941 22,270
4,972 1,532 27,004 6,447 3,291 6,678 15,709 6,758
December 16, 2017
(1,000 chicks)
22,038 22,621
5,298 1,254 27,468 5,938 3,127 6,299 15,616 5,654
December 23, 2017
(1,000 chicks)
21,554 21,402
6,043 1,392 29,080 6,256 3,252 6,306 15,595 5,683
North Carolina .................................... Oklahoma ........................................... Pennsylvania ...................................... South Carolina .................................. Texas ................................................. Virginia ............................................... California, Tennessee,
and West Virginia ..............................
16,702 4,599 3,066 5,245
12,531 5,731
11,354
17,643 3,095 3,931 4,898
12,157 5,488
10,218
17,566 4,378 4,094 4,441
13,047 5,222
9,720
17,549 3,207 3,895 5,263
13,322 5,412
10,171
18,236 4,133 4,050 4,149
13,316 5,606
10,288
18,026 5,403 3,909 4,943
13,599 5,399
10,399
19 State total ...................................... Percent of previous year .....................
170,736 103
167,776 100
170,730 100
176,421 102
175,091 102
178,241 103
Other States .......................................
6,741
7,102
7,325
7,242
6,688
7,324
United States ...................................... Percent of previous year .....................
177,477 103
174,878 100
178,055 100
183,663 102
181,779 101
185,565 104
Source: USDA National Agricultural Statistics Service, Broiler Hatchery, December 28, 2017. For additional information, the full report can be viewed at http://usda.mannlib.cornell.edu/MannUsda/viewDocumentInfo.do?documentID=1010
USDA is an equal opportunity provider and employer. All NASS reports are available, at no cost, on the NASS website: http://www.nass.usda.gov