- Collection:
- Georgia Government Publications
- Serial:
- Broiler hatchery news release / United States Department of Agriculture National Agricultural Statistics Service.
- Title:
- Georgia weekly hatchery, 2017 December 13
- Creator:
- Georgia Agricultural Statistics Service
- Contributor to Resource:
- Georgia. Agricultural Statistics Service
- Publisher:
- Athens, Ga. : Georgia Agricultural Statistics Service
- Date of Original:
- 2017-12-13
- Subject:
- Poultry--Hatcheries--Georgia--Statistics--Periodicals
Eggs--Production--Georgia--Statistics--Periodicals - Location:
- United States, Georgia, 32.75042, -83.50018
- Medium:
- serials (publications)
- Type:
- Text
- Format:
- application/pdf
- Description:
- This news release contains Georgia agricultural statistics. Issue for Jan. 10, 2007 has title: News release. Issues for Jan. 17, 2007- have title: GA weekly hatchery news release. Issues for June 2007- have title: GA broiler hatchery news release. Also published under the title "ga-broilers weekly hatchery report."
- External Identifiers:
- Call Number GA A400.C7 P1 H2 2017/12-13
- Metadata URL:
- https://dlg.galileo.usg.edu/id:dlg_ggpd_i-ga-ba400-pc7-bp1-bh2-b2017-s12-h13-belec-p-btext
- Digital Object URL:
- https://dlg.galileo.usg.edu/do:dlg_ggpd_i-ga-ba400-pc7-bp1-bh2-b2017-s12-h13-belec-p-btext
- Language:
- eng
- Holding Institution:
- University of Georgia. Map and Government Information Library
- Rights:
-

United States Department of Agriculture National Agricultural Statistics Service
Southern Region News Release Broiler Hatchery
Cooperating with the Alabama Department of Agriculture and Industries, Florida Department of Agriculture and Consumer Services, Georgia Department of Agriculture, and South Carolina Department of Agriculture
Southern Regional Field Office 355 East Hancock Avenue, Suite 100 Athens, GA 30601 (706) 546-2236 www.nass.usda.gov
December 13, 2017
Media Contact: Jim Ewing
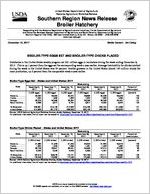
BROILER-TYPE EGGS SET AND BROILER-TYPE CHICKS PLACED
Hatcheries in the United States weekly program set 221 million eggs in incubators during the week ending December 9, 2017. This is up 1 percent from the eggs set the corresponding week a year earlier. Average hatchability for chicks hatched during the week in the United States was 83 percent. Broiler growers in the United States placed 184 million chicks for meat production, up 2 percent from the comparable week a year earlier.
Broiler-Type Eggs Set States and United States: 2017
State
Alabama ............. Florida ................ Georgia .............. South Carolina....
November 4, 2017
(1,000 eggs)
28,030 1,224
33,872 5,562
November 11, 2017
(1,000 eggs)
29,464 1,225
34,395 5,377
November 18, 2017
(1,000 eggs)
30,274 1,223
35,034 5,734
Week ending
November 25, 2017
(1,000 eggs)
29,632 1,224
35,099 5,617
December 2, 2017
(1,000 eggs)
30,488 1,225
35,486 5,803
December 9, 2017
(1,000 eggs)
29,876 1,225
34,427 5,572
Percent of previous year
(percent)
100 100 101 102
19 State total ......
205,921
212,105
217,228
215,709
220,700
211,995
101
United States ......
214,928
221,779
226,849
225,103
230,063
220,908
101
Source: USDA National Agricultural Statistics Service, Broiler Hatchery, December 13, 2017. For additional information, the full report can be viewed at http://usda.mannlib.cornell.edu/MannUsda/viewDocumentInfo.do?documentID=1010
Broiler-Type Chicks Placed States and United States: 2017
Week ending
State
November 4, 2017
November 11, 2017
November 18, 2017
November 25, 2017
(1,000 chicks) (1,000 chicks) (1,000 chicks) (1,000 chicks)
Alabama ............. Florida ................ Georgia .............. South Carolina....
21,964 1,324
26,709 5,028
21,346 1,345
28,347 4,005
21,340 1,582
26,481 5,245
20,304 1,461
25,822 4,898
December 2, 2017
(1,000 chicks)
21,303 1,429
27,014 4,437
December 9, 2017
(1,000 chicks)
22,978 1,532
27,009 5,275
Percent of previous year
(percent)
105 120
99 97
19 State total ......
167,810
169,076
170,741
167,788
170,711
176,363
102
United States ......
175,049
175,952
177,482
174,890
178,013
183,567
102
Source: USDA National Agricultural Statistics Service, Broiler Hatchery, December 13, 2017. For additional information, the full report can be viewed at http://usda.mannlib.cornell.edu/MannUsda/viewDocumentInfo.do?documentID=1010
USDA is an equal opportunity provider and employer. All NASS reports are available, at no cost, on the NASS website: http://www.nass.usda.gov
Broiler-Type Eggs Set 19 Selected States and United States: 2017
State
November 4, 2017
November 11, 2017
Week ending
November 18, November 25,
2017
2017
(1,000 eggs)
(1,000 eggs)
(1,000 eggs)
(1,000 eggs)
Alabama ............................................. Arkansas ............................................ Delaware ............................................ Florida ................................................ Georgia .............................................. Kentucky ............................................. Louisiana ............................................ Maryland ............................................. Mississippi .......................................... Missouri ..............................................
28,030 23,152
4,757 1,224 33,872 7,186 3,258 8,227 16,999 6,744
29,464 23,828
4,890 1,225 34,395 7,752 3,379 7,811 17,741 8,072
30,274 23,709
4,890 1,223 35,034 7,854 3,772 8,259 18,527 8,319
29,632 23,859
4,916 1,224 35,099 7,080 3,591 8,254 18,405 8,319
North Carolina .................................... Oklahoma ........................................... Pennsylvania ...................................... South Carolina .................................... Texas ................................................. Virginia ............................................... California, Tennessee,
and West Virginia ..............................
21,984 7,342 4,906 5,562
14,840 6,215
11,623
21,291 7,692 5,441 5,377
16,114 5,727
11,906
22,041 7,560 5,349 5,734
16,143 6,549
11,991
21,935 7,718 5,482 5,617
16,085 6,452
12,041
19 State total ...................................... Percent of previous year .....................
205,921 101
212,105 102
217,228 103
215,709 102
Other States .......................................
9,007
9,674
9,621
9,394
United States ...................................... Percent of previous year .....................
214,928 101
221,779 102
226,849 103
225,103 102
December 2, 2017
(1,000 eggs)
30,488 23,860
4,913 1,225 35,486 7,977 4,029 8,256 18,451 8,317
23,130 7,684 5,330 5,803
16,613 6,563
12,575
220,700 105
9,363
230,063 105
December 9, 2017
(1,000 eggs)
29,876 23,718
4,916 1,225 34,427 7,709 2,926 8,249 18,663 8,316
20,893 7,288 5,352 5,572
15,519 6,289
11,057
211,995 101
8,913
220,908 101
Broiler-Type Chicks Placed 19 Selected States and United States: 2017
State
November 4, 2017
November 11, 2017
Week ending
November 18, November 25,
2017
2017
(1,000 chicks) (1,000 chicks) (1,000 chicks) (1,000 chicks)
Alabama ............................................. Arkansas ............................................ Delaware ............................................ Florida ................................................ Georgia .............................................. Kentucky ............................................. Louisiana ............................................ Maryland ............................................. Mississippi .......................................... Missouri ..............................................
21,964 20,548
5,349 1,324 26,709 5,538 2,632 5,506 14,010 6,232
21,346 21,084
5,454 1,345 28,347 5,078 2,865 6,193 15,028 6,414
21,340 21,137
5,703 1,582 26,481 5,720 3,272 6,098 14,865 5,315
20,304 22,396
4,490 1,461 25,822 5,959 2,747 7,428 14,354 5,397
December 2, 2017
(1,000 chicks)
21,303 21,916
5,757 1,429 27,014 6,411 2,689 4,995 14,875 5,889
December 9, 2017
(1,000 chicks)
22,978 22,288
4,972 1,532 27,009 6,447 3,291 6,678 15,649 6,758
North Carolina .................................... Oklahoma ........................................... Pennsylvania ...................................... South Carolina .................................... Texas ................................................. Virginia ............................................... California, Tennessee,
and West Virginia ..............................
16,492 4,126 3,831 5,028
12,896 6,207
9,418
16,689 2,504 3,665 4,005
12,853 5,666
10,540
16,702 4,599 3,066 5,245
12,531 5,731
11,354
17,643 3,095 3,931 4,898
12,157 5,488
10,218
17,567 4,378 4,063 4,437
13,047 5,221
9,720
17,523 3,206 3,839 5,275
13,334 5,412
10,172
19 State total ...................................... Percent of previous year .....................
167,810 102
169,076 103
170,741 103
167,788 100
170,711 100
176,363 102
Other States .......................................
7,239
6,876
6,741
7,102
7,302
7,204
United States ...................................... Percent of previous year .....................
175,049 102
175,952 103
177,482 103
174,890 100
178,013 100
183,567 102
Source: USDA National Agricultural Statistics Service, Broiler Hatchery, December 13, 2017. For additional information, the full report can be viewed at http://usda.mannlib.cornell.edu/MannUsda/viewDocumentInfo.do?documentID=1010
USDA is an equal opportunity provider and employer. All NASS reports are available, at no cost, on the NASS website: http://www.nass.usda.gov