- Collection:
- Georgia Government Publications
- Serial:
- Broiler hatchery news release / United States Department of Agriculture National Agricultural Statistics Service.
- Title:
- Southern region broiler hatchery news release [Jan. 4, 2017]
- Creator:
- Georgia. Agricultural Statistics Service
- Contributor to Resource:
- Georgia. Agricultural Statistics Service
- Publisher:
- Athens, GA : Georgia. Agricultural Statistics Service
- Date of Original:
- 2017-01-04
- Subject:
- Georgia
- Location:
- United States, Georgia, 32.75042, -83.50018
- Medium:
- publications (documents)
- Type:
- Text
- Format:
- application/pdf
- Description:
- Began with: August 28, 2013.
Effective March 12, 2014, name of issuing body appears as Southern Regional Field Office.
August 28, 2013; title from caption (Georgia Government Publications database, viewed January 19, 2018).
January 17, 2018 (received via e-mail on January 18, 2018 from Georgia Department of Agriculture); (Georgia Government Publications database, viewed November 22, 2017). - External Identifiers:
- Call Number GA A400.C7 P1 H2 2017/1-4
- Metadata URL:
- https://dlg.galileo.usg.edu/id:dlg_ggpd_i-ga-ba400-pc7-bp1-bh2-b2017-s1-h4-belec-p-btext
- Digital Object URL:
- https://dlg.galileo.usg.edu/do:dlg_ggpd_i-ga-ba400-pc7-bp1-bh2-b2017-s1-h4-belec-p-btext
- Language:
- eng
- Holding Institution:
- University of Georgia. Map and Government Information Library
- Rights:
-

United States Department of Agriculture National Agricultural Statistics Service
Southern Region News Release Broiler Hatchery
Cooperating with the Alabama Department of Agriculture and Industries, Florida Department of Agriculture and Consumer Services, Georgia Department of Agriculture, and South Carolina Department of Agriculture
Southern Regional Field Office 355 East Hancock Avenue, Suite 100 Athens, GA 30601 (706) 546-2236 www.nass.usda.gov
January 4, 2017
Media Contact: Jim Ewing
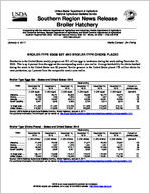
BROILER-TYPE EGGS SET AND BROILER-TYPE CHICKS PLACED
Hatcheries in the United States weekly program set 221 million eggs in incubators during the week ending December 31, 2016. This is up 4 percent from the eggs set the corresponding week a year earlier. Average hatchability for chicks hatched during the week in the United States was 83 percent. Broiler growers in the United States placed 179 million chicks for meat production, up 1 percent from the comparable week a year earlier.
Broiler-Type Eggs Set States and United States: 2016
State
Alabama ............. Florida ................ Georgia .............. South Carolina....
November 26, 2016
(1,000 eggs)
29,835 1,205
34,749 5,521
December 3, 2016
(1,000 eggs)
29,741 1,220
34,467 5,540
December 10, 2016
(1,000 eggs)
30,008 1,224
34,015 5,455
Week ending
December 17, 2016
(1,000 eggs)
29,998 1,193
34,335 5,754
December 24, 2016
(1,000 eggs)
29,772 1,207
34,521 5,514
December 31, 2016
(1,000 eggs)
30,274 1,021
34,255 5,619
Percent of previous year
(percent)
104 83
102 99
19 State total ......
211,032
211,087
210,756
211,828
210,679
212,101
103
United States ......
219,957
219,852
219,541
220,632
219,342
220,796
104
Source: USDA National Agricultural Statistics Service, Broiler Hatchery, January 4, 2017. For additional information, the full report can be viewed at http://usda.mannlib.cornell.edu/MannUsda/viewDocumentInfo.do?documentID=1010
Broiler-Type Chicks Placed States and United States: 2016
State
November 26, 2016
December 3, 2016
December 10, 2016
Week ending
December 17, 2016
(1,000 chicks) (1,000 chicks) (1,000 chicks) (1,000 chicks)
Alabama ............. Florida ................ Georgia .............. South Carolina....
21,848 1,218
26,230 4,964
22,408 1,307
27,223 5,562
21,840 1,278
27,317 5,421
21,677 1,331
28,869 3,992
December 24, 2016
(1,000 chicks)
22,403 1,341
27,446 4,500
December 31, 2016
(1,000 chicks)
22,697 1,161
26,371 4,772
Percent of previous year
(percent)
105 89 96
104
19 State total ......
168,177
170,588
172,410
172,372
172,432
171,979
101
United States ......
174,842
177,530
179,346
179,392
179,351
179,166
101
Source: USDA National Agricultural Statistics Service, Broiler Hatchery, January 4, 2017. For additional information, the full report can be viewed at http://usda.mannlib.cornell.edu/MannUsda/viewDocumentInfo.do?documentID=1010
USDA is an equal opportunity provider and employer. All NASS reports are available, at no cost, on the NASS website: http://www.nass.usda.gov
Broiler-Type Eggs Set 19 Selected States and United States: 2016
State
November 26, 2016
December 3, 2016
Week ending
December 10, December 17,
2016
2016
(1,000 eggs)
(1,000 eggs)
(1,000 eggs)
(1,000 eggs)
Alabama ............................................. Arkansas ............................................ Delaware ............................................ Florida ................................................ Georgia .............................................. Kentucky ............................................. Louisiana ............................................ Maryland ............................................. Mississippi .......................................... Missouri ..............................................
29,835 22,973
5,035 1,205 34,749 7,613 3,667 7,930 17,339 8,186
29,741 22,611
5,052 1,220 34,467 7,689 3,833 8,065 17,373 8,171
30,008 22,637
5,101 1,224 34,015 7,671 3,833 8,086 17,571 8,167
29,998 22,760
5,054 1,193 34,335 7,396 3,833 8,140 17,586 8,157
December 24, 2016
(1,000 eggs)
29,772 22,314
4,926 1,207 34,521 7,448 3,848 8,138 17,525 8,170
December 31, 2016
(1,000 eggs)
30,274 22,947
5,003 1,021 34,255 7,212 3,788 8,126 17,758 7,960
North Carolina .................................... Oklahoma ........................................... Pennsylvania ...................................... South Carolina .................................... Texas ................................................. Virginia ............................................... California, Tennessee,
and West Virginia ..............................
20,666 7,389 4,788 5,521
15,763 6,435
11,938
20,727 7,404 4,933 5,540
15,803 6,474
11,984
20,782 7,482 4,571 5,455
15,946 6,504
11,703
20,772 7,619 4,704 5,754
15,944 6,498
12,085
20,849 7,435 4,680 5,514
15,806 6,505
12,021
21,626 7,620 4,797 5,619
15,511 6,387
12,197
19 State total ...................................... Percent of previous year .....................
211,032 101
211,087 104
210,756 102
211,828 101
210,679 102
212,101 103
Other States .......................................
8,925
8,765
8,785
8,804
8,663
8,695
United States ...................................... Percent of previous year .....................
219,957 102
219,852 105
219,541 102
220,632 102
219,342 102
220,796 104
Broiler-Type Chicks Placed 19 Selected States and United States: 2016
State
November 26, 2016
December 3, 2016
Week ending
December 10, December 17,
2016
2016
(1,000 chicks) (1,000 chicks) (1,000 chicks) (1,000 chicks)
Alabama ............................................. Arkansas ............................................ Delaware ............................................ Florida ................................................ Georgia .............................................. Kentucky ............................................. Louisiana ............................................ Maryland ............................................. Mississippi .......................................... Missouri ..............................................
21,848 20,185
5,452 1,218 26,230 6,041 2,865 6,606 13,863 5,442
22,408 20,240
5,278 1,307 27,223 5,654 2,994 6,324 14,079 5,904
21,840 20,824
5,345 1,278 27,317 6,211 3,041 6,285 14,778 6,600
21,677 21,875
5,488 1,331 28,869 6,288 3,191 5,794 14,582 6,039
December 24, 2016
(1,000 chicks)
22,403 20,939
4,709 1,341 27,446 6,347 3,262 7,495 14,565 5,956
December 31, 2016
(1,000 chicks)
22,697 21,805
4,955 1,161 26,371 5,955 3,290 7,428 14,812 5,445
North Carolina .................................... Oklahoma ........................................... Pennsylvania ...................................... South Carolina .................................... Texas ................................................. Virginia ............................................... California, Tennessee,
and West Virginia ..............................
16,212 4,275 4,003 4,964
12,478 5,487
11,008
16,232 4,906 3,813 5,562
12,976 5,301
10,387
16,348 3,963 3,509 5,421
13,053 5,855
10,742
16,045 3,851 3,740 3,992
13,111 6,322
10,177
16,175 4,647 3,781 4,500
12,927 5,036
10,903
16,752 4,092 3,545 4,772
13,052 4,713
11,134
19 State total ...................................... Percent of previous year .....................
168,177 103
170,588 100
172,410 101
172,372 101
172,432 104
171,979 101
Other States .......................................
6,665
6,942
6,936
7,020
6,919
7,187
United States ...................................... Percent of previous year .....................
174,842 104
177,530 101
179,346 101
179,392 101
179,351 104
179,166 101
Source: USDA National Agricultural Statistics Service, Broiler Hatchery, January 4, 2017. For additional information, the full report can be viewed at http://usda.mannlib.cornell.edu/MannUsda/viewDocumentInfo.do?documentID=1010
USDA is an equal opportunity provider and employer. All NASS reports are available, at no cost, on the NASS website: http://www.nass.usda.gov