- Collection:
- Georgia Government Publications
- Serial:
- Broiler hatchery news release / United States Department of Agriculture National Agricultural Statistics Service.
- Title:
- Southern region broiler hatchery news release [Jan. 18, 2017]
- Creator:
- Georgia. Agricultural Statistics Service
- Contributor to Resource:
- Georgia. Agricultural Statistics Service
- Publisher:
- Athens, GA : Georgia. Agricultural Statistics Service
- Date of Original:
- 2017-01-18
- Subject:
- Georgia
- Location:
- United States, Georgia, 32.75042, -83.50018
- Medium:
- publications (documents)
- Type:
- Text
- Format:
- application/pdf
- Description:
- Began with: August 28, 2013.
Effective March 12, 2014, name of issuing body appears as Southern Regional Field Office.
August 28, 2013; title from caption (Georgia Government Publications database, viewed January 19, 2018).
January 17, 2018 (received via e-mail on January 18, 2018 from Georgia Department of Agriculture); (Georgia Government Publications database, viewed November 22, 2017). - External Identifiers:
- Call Number GA A400.C7 P1 H2 2017/1-18
- Metadata URL:
- https://dlg.galileo.usg.edu/id:dlg_ggpd_i-ga-ba400-pc7-bp1-bh2-b2017-s1-h18-belec-p-btext
- Digital Object URL:
- https://dlg.galileo.usg.edu/do:dlg_ggpd_i-ga-ba400-pc7-bp1-bh2-b2017-s1-h18-belec-p-btext
- Language:
- eng
- Holding Institution:
- University of Georgia. Map and Government Information Library
- Rights:
-

United States Department of Agriculture National Agricultural Statistics Service
Southern Region News Release Broiler Hatchery
Cooperating with the Alabama Department of Agriculture and Industries, Florida Department of Agriculture and Consumer Services, Georgia Department of Agriculture, and South Carolina Department of Agriculture
Southern Regional Field Office 355 East Hancock Avenue, Suite 100 Athens, GA 30601 (706) 546-2236 www.nass.usda.gov
January 18, 2017
Media Contact: Jim Ewing
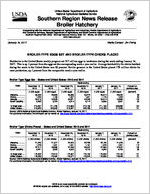
BROILER-TYPE EGGS SET AND BROILER-TYPE CHICKS PLACED
Hatcheries in the United States weekly program set 217 million eggs in incubators during the week ending January 14, 2017. This is up 1 percent from the eggs set the corresponding week a year earlier. Average hatchability for chicks hatched during the week in the United States was 83 percent. Broiler growers in the United States placed 179 million chicks for meat production, up 1 percent from the comparable week a year earlier.
Broiler-Type Eggs Set States and United States: 2016 and 2017
State
December 10, 2016
December 17, 2016
December 24, 2016
Week ending
December 31, 2016
(1,000 eggs)
(1,000 eggs)
(1,000 eggs)
(1,000 eggs)
Alabama ............. Florida ................ Georgia .............. South Carolina....
30,008 1,224
34,015 5,455
29,855 1,193
34,335 5,754
29,589 1,207
34,521 5,514
30,274 1,021
34,245 5,712
January 7, 2017
(1,000 eggs)
29,614 1,175
34,014 5,655
January 14, 2017
(1,000 eggs)
29,540 1,022
34,686 5,361
Percent of previous year
(percent)
98 83 104 93
19 State total ......
210,837
211,709
210,664
212,136
211,165
208,689
100
United States ......
219,622
220,533
219,327
220,788
219,760
217,335
101
Source: USDA National Agricultural Statistics Service, Broiler Hatchery, January 18, 2017. For additional information, the full report can be viewed at http://usda.mannlib.cornell.edu/MannUsda/viewDocumentInfo.do?documentID=1010
Broiler-Type Chicks Placed States and United States: 2016 and 2017
State
December 10, 2016
December 17, 2016
December 24, 2016
Week ending
December 31, 2016
(1,000 chicks) (1,000 chicks) (1,000 chicks) (1,000 chicks)
Alabama ............. Florida ................ Georgia .............. South Carolina....
21,840 1,278
27,317 5,421
21,677 1,331
28,869 3,992
22,403 1,341
27,446 4,500
22,788 1,161
26,447 4,773
January 7, 2017
(1,000 chicks)
22,185 1,376
27,464 4,623
January 14, 2017
(1,000 chicks)
21,025 1,201
27,947 4,793
Percent of previous year
(percent)
92 112 103
99
19 State total ......
172,402
172,412
172,457
172,129
172,333
172,103
101
United States ......
179,338
179,432
179,377
179,324
179,396
178,548
101
Source: USDA National Agricultural Statistics Service, Broiler Hatchery, January 18, 2017. For additional information, the full report can be viewed at http://usda.mannlib.cornell.edu/MannUsda/viewDocumentInfo.do?documentID=1010
USDA is an equal opportunity provider and employer. All NASS reports are available, at no cost, on the NASS website: http://www.nass.usda.gov
Broiler-Type Eggs Set 19 Selected States and United States: 2016 and 2017
State
December 10, 2016
December 17, 2016
Week ending
December 24, December 31,
2016
2016
(1,000 eggs)
(1,000 eggs)
(1,000 eggs)
(1,000 eggs)
Alabama ............................................ Arkansas ............................................ Delaware ............................................ Florida ............................................... Georgia .............................................. Kentucky ............................................. Louisiana ............................................ Maryland ............................................. Mississippi .......................................... Missouri ..............................................
30,008 22,637
5,101 1,224 34,015 7,671 3,833 8,167 17,571 8,167
29,855 22,760
5,054 1,193 34,335 7,396 3,833 8,194 17,586 8,157
29,589 22,314
4,926 1,207 34,521 7,448 3,848 8,196 17,525 8,169
30,274 22,734
5,003 1,021 34,245 7,167 3,788 8,195 17,788 7,960
North Carolina .................................... Oklahoma ........................................... Pennsylvania ...................................... South Carolina .................................. Texas ................................................. Virginia ............................................... California, Tennessee,
and West Virginia ..............................
20,782 7,482 4,571 5,455
15,946 6,504
11,703
20,772 7,619 4,704 5,754
15,944 6,498
12,055
20,849 7,435 4,791 5,514
15,806 6,505
12,021
21,327 7,831 4,749 5,712
15,799 6,387
12,156
19 State total ...................................... Percent of previous year .....................
210,837 102
211,709 101
210,664 102
212,136 103
Other States .......................................
8,785
8,824
8,663
8,652
United States ...................................... Percent of previous year .....................
219,622 102
220,533 102
219,327 102
220,788 104
January 7, 2017
(1,000 eggs)
29,614 22,413
5,089 1,175 34,014 7,245 3,348 8,193 17,495 8,101
21,462 7,737 4,711 5,655
16,025 6,513
12,375
211,165 102
8,595
219,760 102
January 14, 2017
(1,000 eggs)
29,540 20,796
4,893 1,022 34,686 7,301 3,439 8,193 17,375 8,105
21,461 7,637 4,625 5,361
16,105 6,512
11,638
208,689 100
8,646
217,335 101
Broiler-Type Chicks Placed 19 Selected States and United States: 2016 and 2017
State
December 10, 2016
December 17, 2016
Week ending
December 24, December 31,
2016
2016
(1,000 chicks) (1,000 chicks) (1,000 chicks) (1,000 chicks)
Alabama ............................................ Arkansas ............................................ Delaware ............................................ Florida ............................................... Georgia .............................................. Kentucky ............................................. Louisiana ............................................ Maryland ............................................. Mississippi .......................................... Missouri ..............................................
21,840 20,824
5,356 1,278 27,317 6,211 3,041 6,313 14,778 6,600
21,677 21,875
5,163 1,331 28,869 6,288 3,191 6,066 14,582 6,039
22,403 20,939
4,389 1,341 27,446 6,347 3,262 7,914 14,565 5,942
22,788 21,701
4,704 1,161 26,447 5,955 3,290 7,773 14,668 5,781
January 7, 2017
(1,000 chicks)
22,185 21,308
6,129 1,376 27,464 5,681 3,262 5,582 14,746 5,915
January 14, 2017
(1,000 chicks)
21,025 19,889
5,532 1,201 27,947 5,656 3,324 6,335 15,011 5,887
North Carolina .................................... Oklahoma ........................................... Pennsylvania ...................................... South Carolina .................................. Texas ................................................. Virginia ............................................... California, Tennessee,
and West Virginia ..............................
16,348 3,963 3,509 5,421
13,053 5,808
10,742
16,045 3,851 3,740 3,992
13,111 6,415
10,177
16,175 4,647 3,783 4,500
12,927 4,984
10,893
16,606 4,092 3,651 4,773
13,015 4,602
11,122
16,752 4,333 3,744 4,623
13,206 5,614
10,413
16,776 5,411 3,720 4,793
12,840 5,320
11,436
19 State total ...................................... Percent of previous year .....................
172,402 101
172,412 101
172,457 104
172,129 101
172,333 101
172,103 101
Other States .......................................
6,936
7,020
6,920
7,195
7,063
6,445
United States ...................................... Percent of previous year .....................
179,338 101
179,432 101
179,377 104
179,324 102
179,396 101
178,548 101
Source: USDA National Agricultural Statistics Service, Broiler Hatchery, January 18, 2017. For additional information, the full report can be viewed at http://usda.mannlib.cornell.edu/MannUsda/viewDocumentInfo.do?documentID=1010
USDA is an equal opportunity provider and employer. All NASS reports are available, at no cost, on the NASS website: http://www.nass.usda.gov